| Red | Green | Blue | |
| z | 17.64 | ||
| znorm | Inf | ||
| sky | -Inf | -Inf | -NaN |
| S/N | 22.3 | 37.3 | 40.0 |
| S/N(c) | 37.4 | 12.8 | 12.9 |
| SN(E/C) |
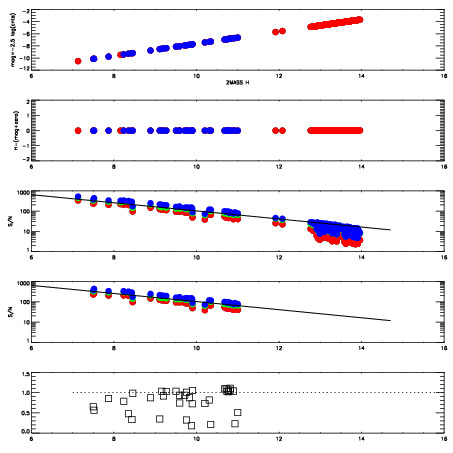
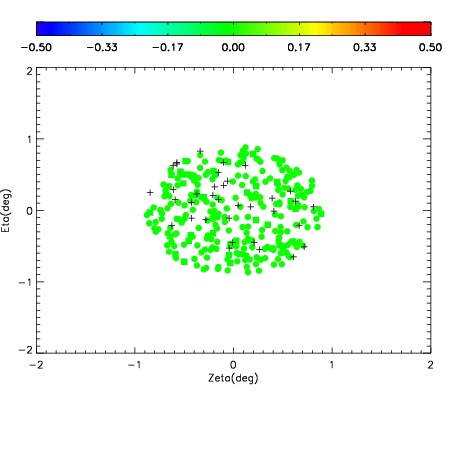
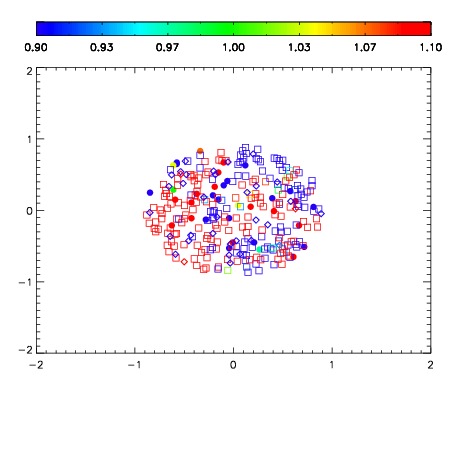
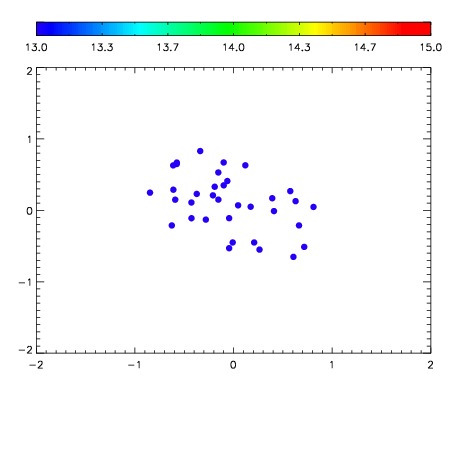

| Frame | Nreads | Zeropoints | Mag plots | Spatial mag deviation | Spatial sky 16325A emission deviations (filled: sky, open: star) | Spatial sky continuum emission | Spatial sky telluric CO2 absorption deviations (filled: H < 10) | |||||||||||||||||||||||
| 0 | 0 |
|
|
|
|
|
|
| IPAIR | NAME | SHIFT | NEWSHIFT | S/N | NAME | SHIFT | NEWSHIFT | S/N |
| 0 | 19380074 | 0.490253 | 0.00000 | 18.9533 | 19380073 | 0.00120749 | 0.489046 | 18.9874 |
| 1 | 19380071 | 0.487693 | 0.00255999 | 18.9022 | 19380072 | 0.00151637 | 0.488737 | 18.9402 |
| 2 | 19380070 | 0.487620 | 0.00263301 | 18.8101 | 19380069 | 0.00000 | 0.490253 | 18.9193 |