| Red | Green | Blue | |
| z | 17.65 | ||
| znorm | Inf | ||
| sky | -Inf | -Inf | -Inf |
| S/N | 12.4 | 21.7 | 23.4 |
| S/N(c) | 25.8 | 8.8 | 8.8 |
| SN(E/C) |
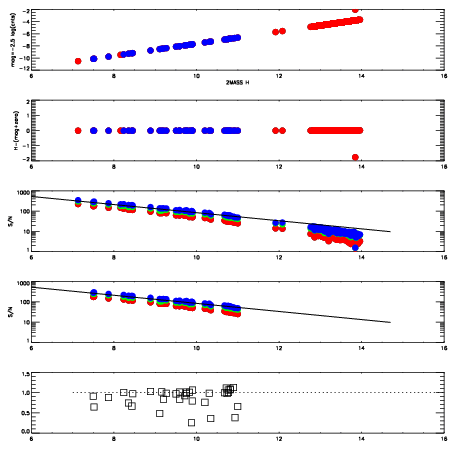
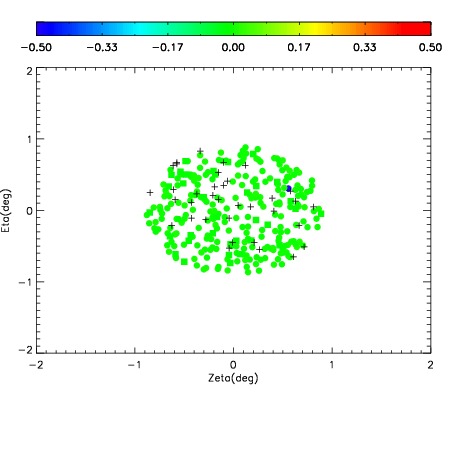
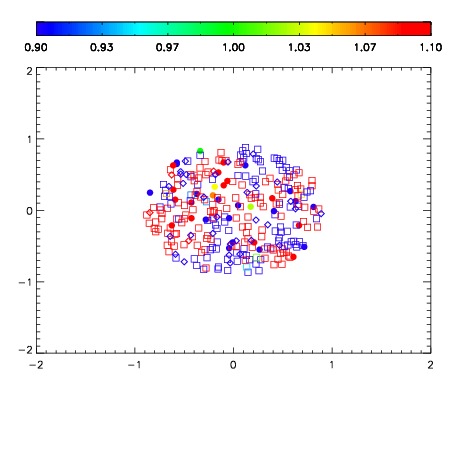
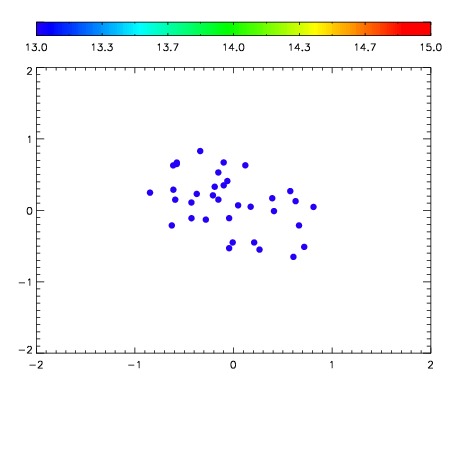

| Frame | Nreads | Zeropoints | Mag plots | Spatial mag deviation | Spatial sky 16325A emission deviations (filled: sky, open: star) | Spatial sky continuum emission | Spatial sky telluric CO2 absorption deviations (filled: H < 10) | |||||||||||||||||||||||
| 0 | 0 |
|
|
|
|
|
|
| IPAIR | NAME | SHIFT | NEWSHIFT | S/N | NAME | SHIFT | NEWSHIFT | S/N |
| 0 | 19620056 | 0.495914 | 0.00000 | 18.4340 | 19620057 | 0.00156427 | 0.494350 | 18.2657 |
| 1 | 19620055 | 0.494095 | 0.00181901 | 18.6935 | 19620054 | 0.00000 | 0.495914 | 18.7163 |