| Red | Green | Blue | |
| z | 17.64 | ||
| znorm | Inf | ||
| sky | -Inf | -Inf | -Inf |
| S/N | 26.0 | 43.1 | 46.8 |
| S/N(c) | 27.3 | 65.6 | 17.1 |
| SN(E/C) |
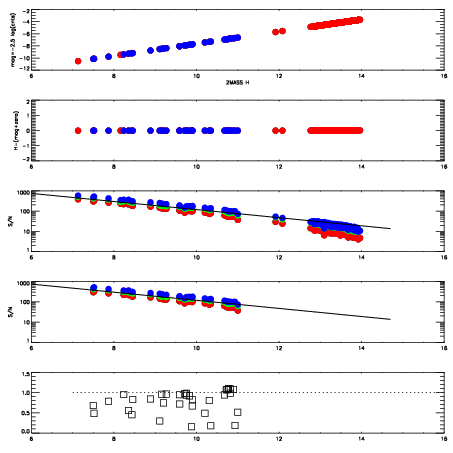
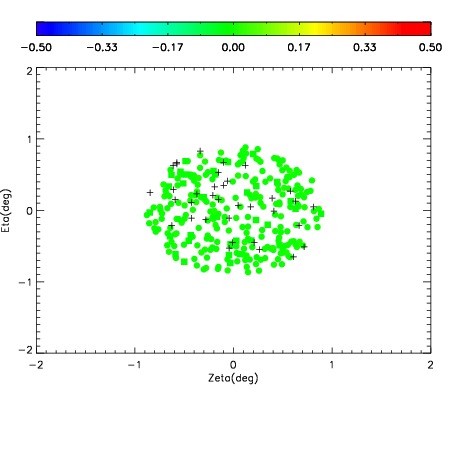
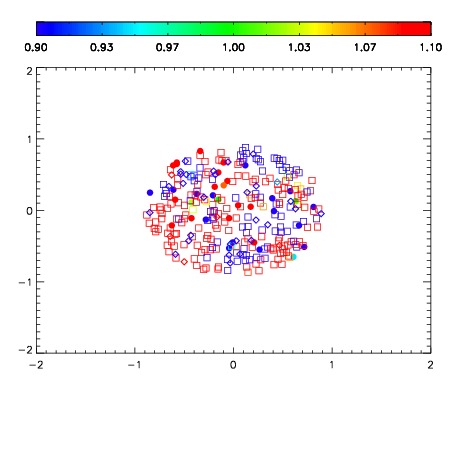


| Frame | Nreads | Zeropoints | Mag plots | Spatial mag deviation | Spatial sky 16325A emission deviations (filled: sky, open: star) | Spatial sky continuum emission | Spatial sky telluric CO2 absorption deviations (filled: H < 10) | |||||||||||||||||||||||
| 0 | 0 |
|
|
|
|
|
|
| IPAIR | NAME | SHIFT | NEWSHIFT | S/N | NAME | SHIFT | NEWSHIFT | S/N |
| 0 | 19710054 | 0.498456 | 0.00000 | 19.0190 | 19710055 | 0.00391628 | 0.494540 | 18.9980 |
| 1 | 19710053 | 0.497654 | 0.000802010 | 18.9573 | 19710048 | 0.00000 | 0.498456 | 18.9405 |
| 2 | 19710049 | 0.495148 | 0.00330800 | 18.8878 | 19710051 | -0.000705155 | 0.499161 | 18.9271 |
| 3 | 19710050 | 0.496178 | 0.00227800 | 18.8390 | 19710052 | 0.000958442 | 0.497498 | 18.7365 |