| Red | Green | Blue | |
| z | 17.64 | ||
| znorm | Inf | ||
| sky | -Inf | -Inf | -Inf |
| S/N | 21.3 | 34.8 | 37.4 |
| S/N(c) | 22.3 | 10.0 | 13.7 |
| SN(E/C) |
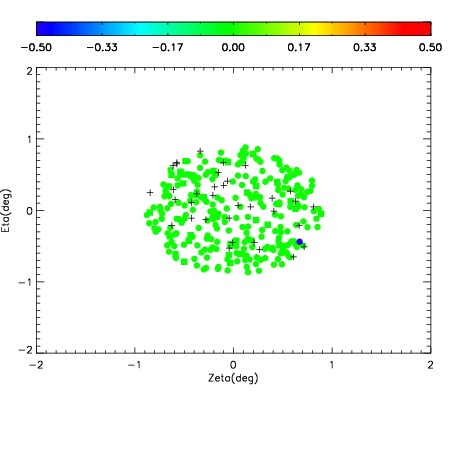
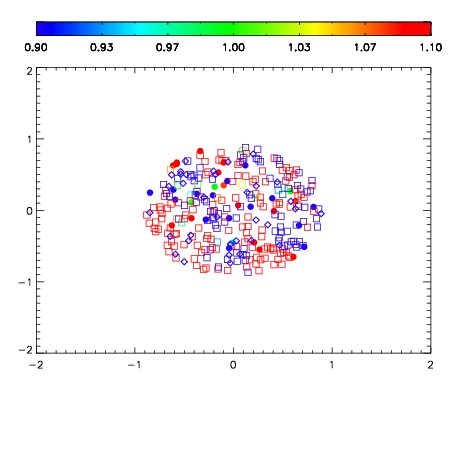


| Frame | Nreads | Zeropoints | Mag plots | Spatial mag deviation | Spatial sky 16325A emission deviations (filled: sky, open: star) | Spatial sky continuum emission | Spatial sky telluric CO2 absorption deviations (filled: H < 10) | |||||||||||||||||||||||
| 0 | 0 |
|
|
|
|
|
|
| IPAIR | NAME | SHIFT | NEWSHIFT | S/N | NAME | SHIFT | NEWSHIFT | S/N |
| 0 | 19950027 | 0.00000 | 0.00000 | 19.1332 | 19950028 | -0.502798 | 0.502798 | 19.1374 |
| 1 | 19950030 | -0.000143648 | 0.000143648 | 19.1818 | 19950029 | -0.502222 | 0.502222 | 19.1760 |