| Red | Green | Blue | |
| z | 17.64 | ||
| znorm | Inf | ||
| sky | -Inf | -Inf | -Inf |
| S/N | 27.5 | 43.4 | 51.4 |
| S/N(c) | 41.5 | 25.4 | 43.4 |
| SN(E/C) |


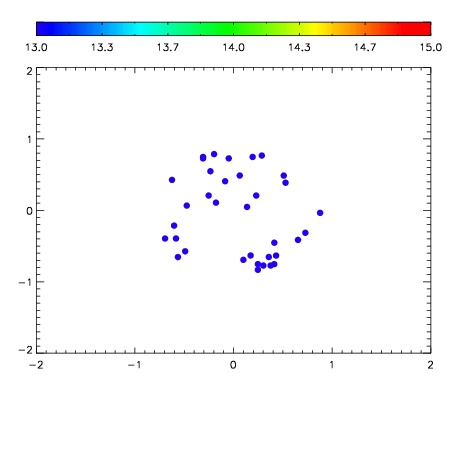

| Frame | Nreads | Zeropoints | Mag plots | Spatial mag deviation | Spatial sky 16325A emission deviations (filled: sky, open: star) | Spatial sky continuum emission | Spatial sky telluric CO2 absorption deviations (filled: H < 10) | |||||||||||||||||||||||
| 0 | 0 |
|
|
|
|
|
|
| IPAIR | NAME | SHIFT | NEWSHIFT | S/N | NAME | SHIFT | NEWSHIFT | S/N |
| 0 | 19110074 | 0.00000 | 0.00000 | 19.0718 | 19110076 | -0.501689 | 0.501689 | 19.1001 |
| 1 | 19110078 | -0.000594811 | 0.000594811 | 19.1046 | 19110075 | -0.501591 | 0.501591 | 19.1164 |
| 2 | 19110077 | -0.000315049 | 0.000315049 | 19.0885 | 19110079 | -0.502305 | 0.502305 | 19.1041 |