| Red | Green | Blue | |
| z | 17.64 | ||
| znorm | Inf | ||
| sky | -Inf | -Inf | -Inf |
| S/N | 20.9 | 33.5 | 39.3 |
| S/N(c) | 12.1 | 26.4 | 50.7 |
| SN(E/C) |
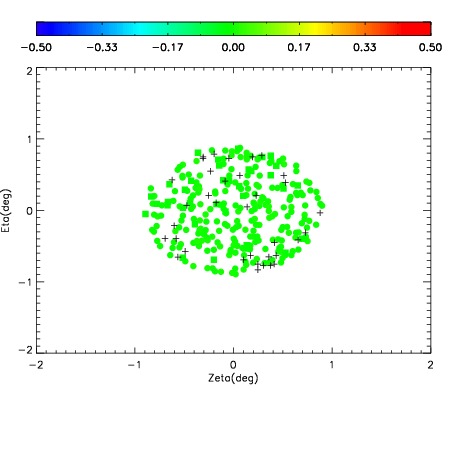
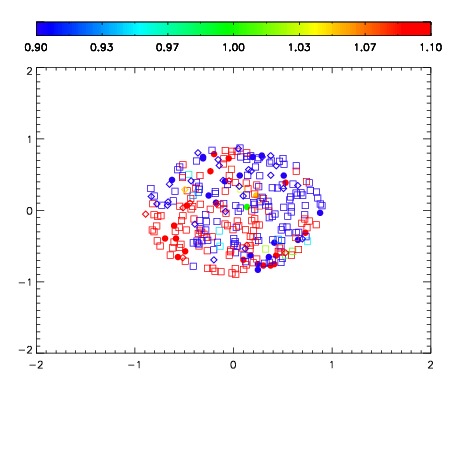


| Frame | Nreads | Zeropoints | Mag plots | Spatial mag deviation | Spatial sky 16325A emission deviations (filled: sky, open: star) | Spatial sky continuum emission | Spatial sky telluric CO2 absorption deviations (filled: H < 10) | |||||||||||||||||||||||
| 0 | 0 |
|
|
|
|
|
|
| IPAIR | NAME | SHIFT | NEWSHIFT | S/N | NAME | SHIFT | NEWSHIFT | S/N |
| 0 | 19360073 | 0.00142354 | 0.00000 | 19.0989 | 19360072 | -0.485585 | 0.487009 | 18.9721 |
| 1 | 19360070 | 0.00000 | 0.00142354 | 18.6656 | 19360071 | -0.485714 | 0.487138 | 18.7053 |