| Red | Green | Blue | |
| z | 17.64 | ||
| znorm | Inf | ||
| sky | -Inf | -Inf | -Inf |
| S/N | 27.8 | 43.8 | 51.7 |
| S/N(c) | 39.6 | 41.2 | 29.6 |
| SN(E/C) |
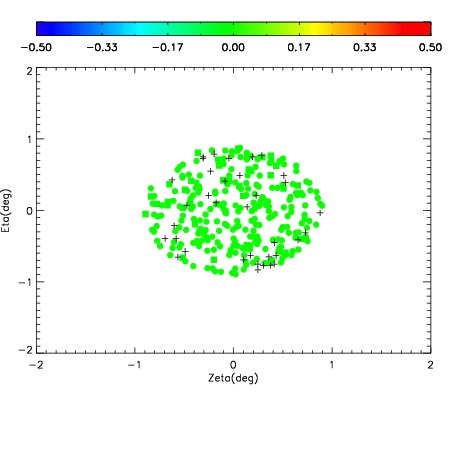

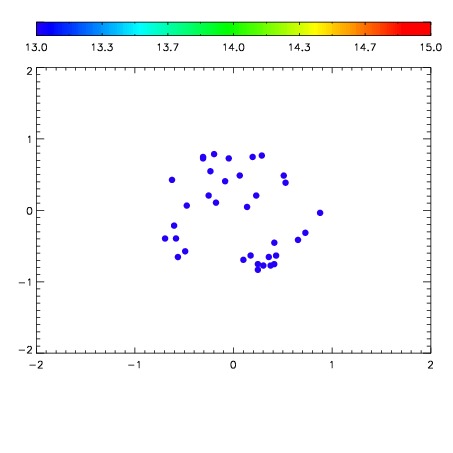

| Frame | Nreads | Zeropoints | Mag plots | Spatial mag deviation | Spatial sky 16325A emission deviations (filled: sky, open: star) | Spatial sky continuum emission | Spatial sky telluric CO2 absorption deviations (filled: H < 10) | |||||||||||||||||||||||
| 0 | 0 |
|
|
|
|
|
|
| IPAIR | NAME | SHIFT | NEWSHIFT | S/N | NAME | SHIFT | NEWSHIFT | S/N |
| 0 | 19930037 | 0.499344 | 0.00000 | 19.1471 | 19930036 | 0.00403496 | 0.495309 | 19.1486 |
| 1 | 19930033 | 0.494803 | 0.00454098 | 19.0734 | 19930035 | 0.00370038 | 0.495644 | 19.0686 |
| 2 | 19930034 | 0.494710 | 0.00463399 | 19.0520 | 19930032 | 0.00000 | 0.499344 | 19.0658 |