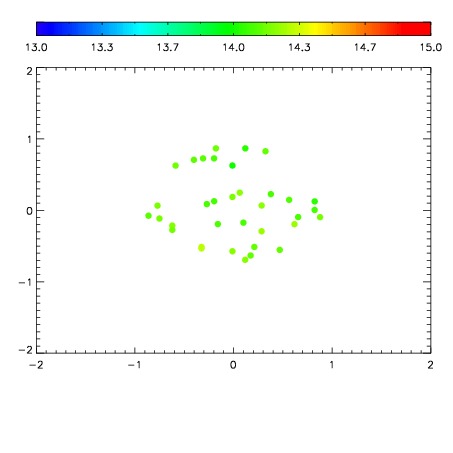
| Frame | Nreads | Zeropoints | Mag plots
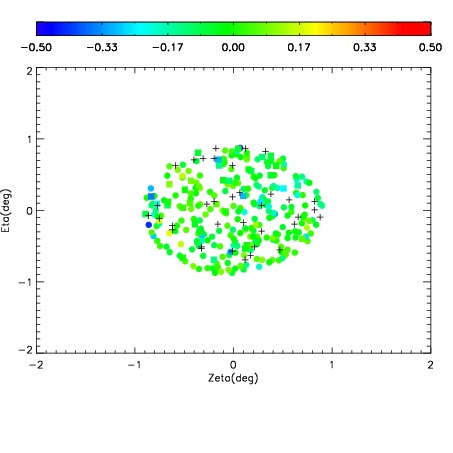
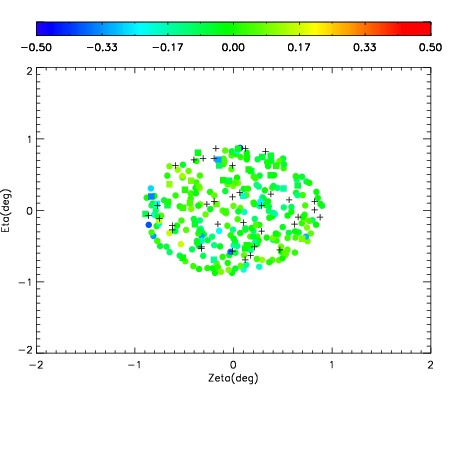
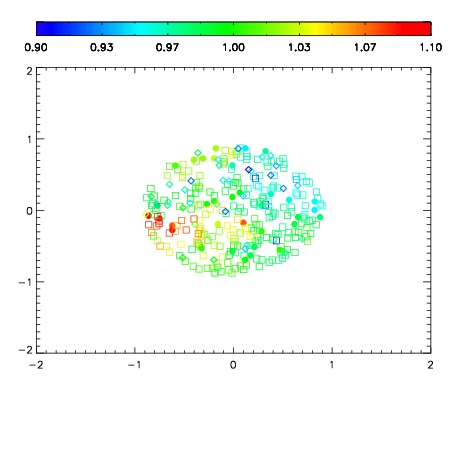
| Spatial mag deviation
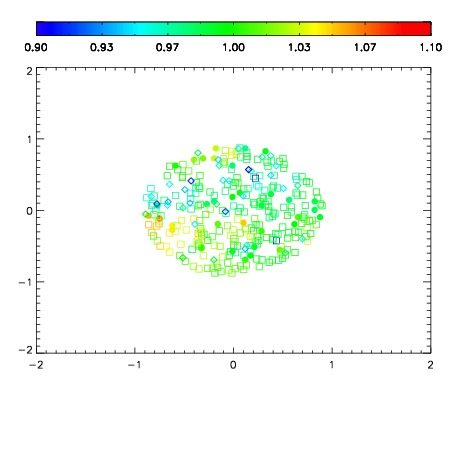
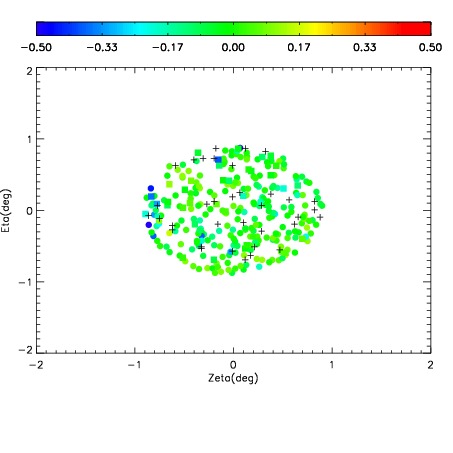
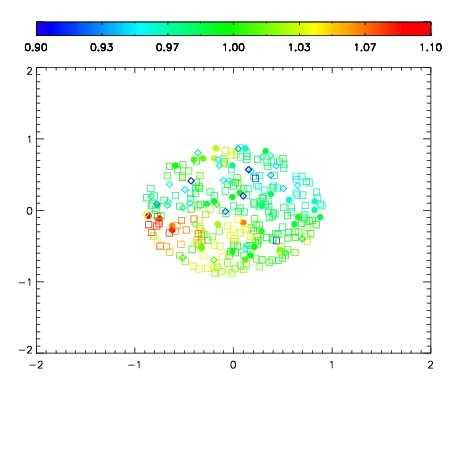
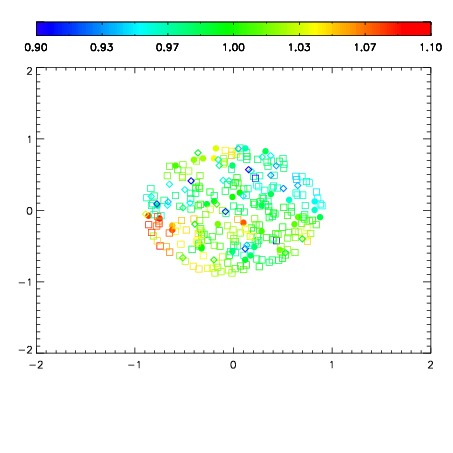
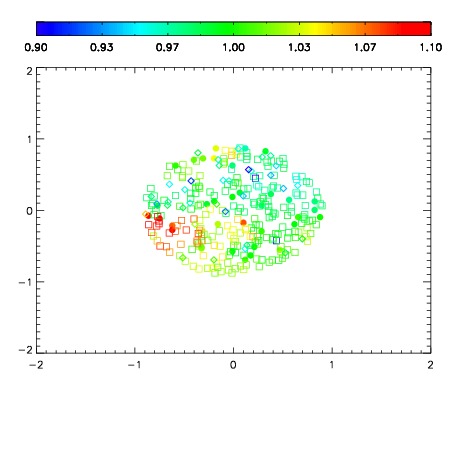
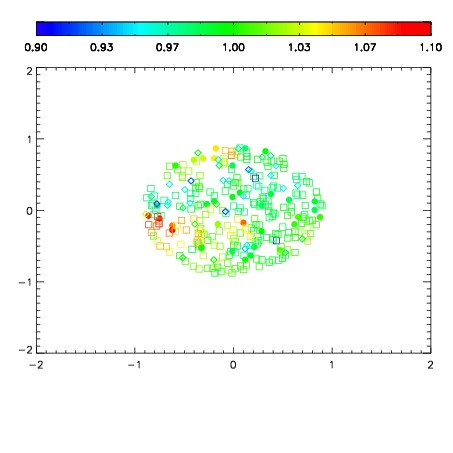
| Spatial sky 16325A emission deviations (filled: sky, open: star)
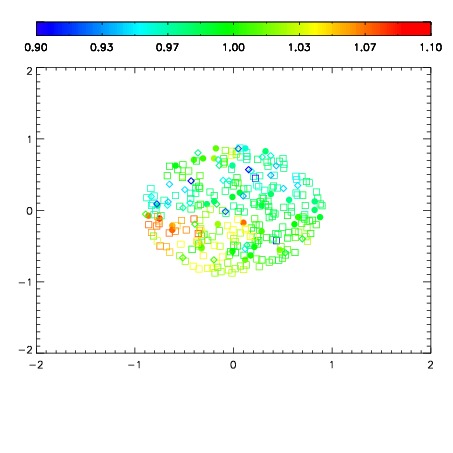
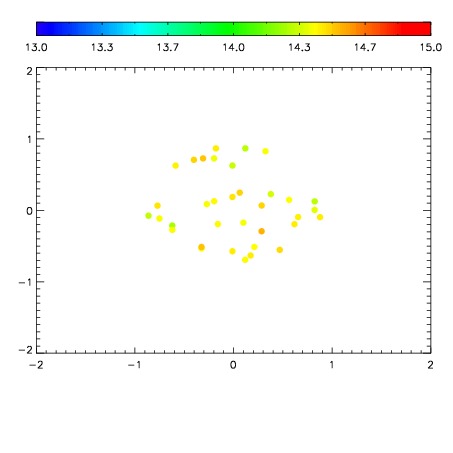
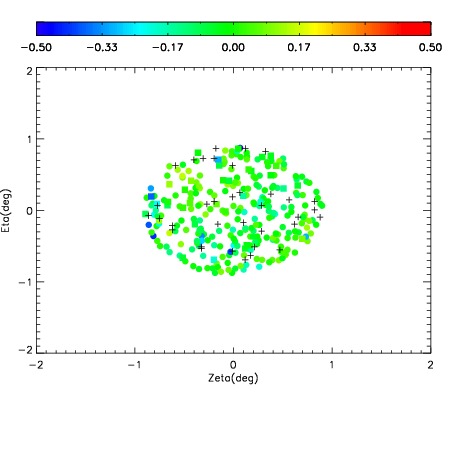
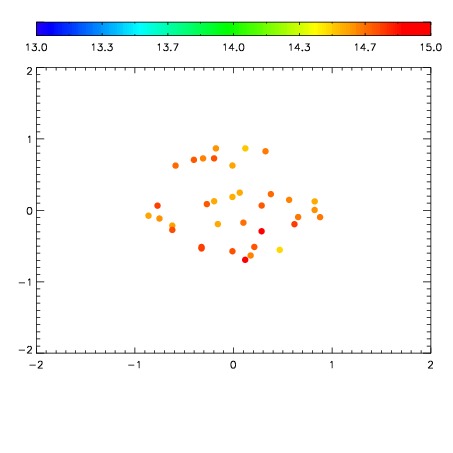
| Spatial sky continuum emission
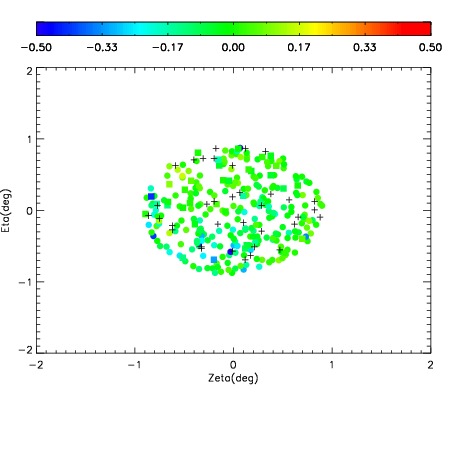
| Spatial sky telluric CO2 absorption deviations (filled: H < 10)
|
| 16070044
| 47
| | Red | Green | Blue
| | z | | 19.06
| | znorm | | 14.88
| | sky | 14.5 | 14.2 | 14.4
| | S/N | 17.7 | 26.6 | 30.3
| | S/N(c) | 13.9 | 14.5 | 39.1
| | SN(E/C) 0.68
|
| 
| 
| 
| 
| 
|
| 16070045
| 47
| | Red | Green | Blue
| | z | | 19.08
| | znorm | | 14.90
| | sky | 14.6 | 14.4 | 14.5
| | S/N | 17.8 | 26.8 | 30.0
| | S/N(c) | 13.8 | 14.7 | 38.8
| | SN(E/C) 0.70
|
| 
| 
| 
| 
| 
|
| 16070046
| 47
| | Red | Green | Blue
| | z | | 19.14
| | znorm | | 14.96
| | sky | 14.8 | 14.4 | 14.7
| | S/N | 18.4 | 27.5 | 31.0
| | S/N(c) | 14.1 | 14.9 | 39.8
| | SN(E/C) 0.77
|
| 
| 
| 
| 
| 
|
| 16070047
| 47
| | Red | Green | Blue
| | z | | 19.12
| | znorm | | 14.94
| | sky | 14.7 | 14.6 | 14.7
| | S/N | 18.3 | 27.4 | 30.8
| | S/N(c) | 14.3 | 15.1 | 39.8
| | SN(E/C) 0.78
|
| 
| 
| 
| 
| 
|
| 16070048
| 47
| | Red | Green | Blue
| | z | | 19.11
| | znorm | | 14.93
| | sky | 14.8 | 14.7 | 14.7
| | S/N | 18.2 | 27.6 | 31.0
| | S/N(c) | 14.4 | 15.1 | 40.1
| | SN(E/C) 0.74
|
| 
| 
| 
| 
| 
|
| 16070049
| 47
| | Red | Green | Blue
| | z | | 19.18
| | znorm | | 15.00
| | sky | 14.6 | 14.6 | 14.6
| | S/N | 19.0 | 28.5 | 32.2
| | S/N(c) | 14.9 | 15.5 | 41.1
| | SN(E/C) 0.73
|
| 
| 
| 
| 
| 
|
| 16070050
| 47
| | Red | Green | Blue
| | z | | 19.15
| | znorm | | 14.97
| | sky | 15.0 | 14.7 | 14.6
| | S/N | 19.1 | 28.4 | 32.3
| | S/N(c) | 14.8 | 15.5 | 40.7
| | SN(E/C) 0.71
|
| 
| 
| 
| 
| 
|
| 16070051
| 47
| | Red | Green | Blue
| | z | | 19.20
| | znorm | | 15.02
| | sky | 14.6 | 14.5 | 14.5
| | S/N | 19.5 | 29.2 | 33.2
| | S/N(c) | 15.1 | 15.8 | 41.3
| | SN(E/C) 0.74
|
| 
| 
| 
| 
| 
|