| Red | Green | Blue | |
| z | 17.64 | ||
| znorm | Inf | ||
| sky | -Inf | -Inf | -NaN |
| S/N | 33.8 | 52.9 | 60.4 |
| S/N(c) | 28.9 | 30.3 | 80.1 |
| SN(E/C) |
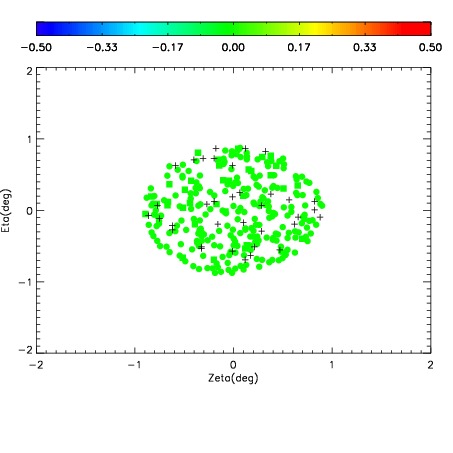
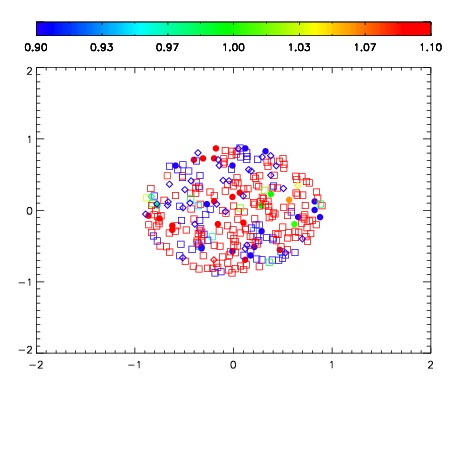
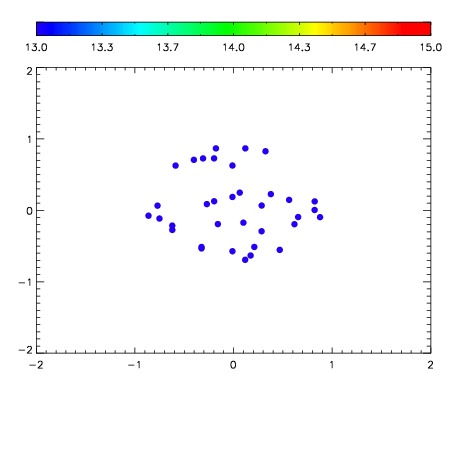

| Frame | Nreads | Zeropoints | Mag plots | Spatial mag deviation | Spatial sky 16325A emission deviations (filled: sky, open: star) | Spatial sky continuum emission | Spatial sky telluric CO2 absorption deviations (filled: H < 10) | |||||||||||||||||||||||
| 0 | 0 |
|
|
|
|
|
|
| IPAIR | NAME | SHIFT | NEWSHIFT | S/N | NAME | SHIFT | NEWSHIFT | S/N |
| 0 | 16070046 | 0.490538 | 0.00000 | 19.1446 | 16070048 | 0.000330197 | 0.490208 | 19.1160 |
| 1 | 16070049 | 0.489826 | 0.000712007 | 19.1867 | 16070051 | 0.00202976 | 0.488508 | 19.1992 |
| 2 | 16070050 | 0.490222 | 0.000315994 | 19.1622 | 16070047 | 0.00128378 | 0.489254 | 19.1304 |
| 3 | 16070045 | 0.489659 | 0.000878990 | 19.0837 | 16070044 | 0.00000 | 0.490538 | 19.0751 |