| Red | Green | Blue | |
| z | 17.64 | ||
| znorm | Inf | ||
| sky | -Inf | -Inf | -Inf |
| S/N | 25.3 | 41.2 | 47.2 |
| S/N(c) | 20.2 | 21.5 | 29.3 |
| SN(E/C) |
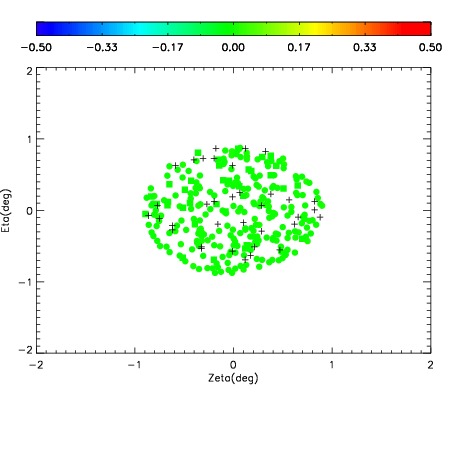
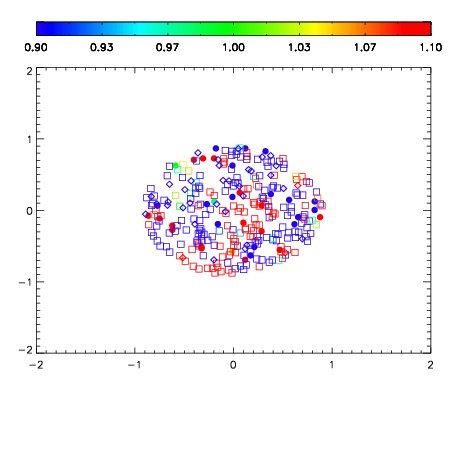
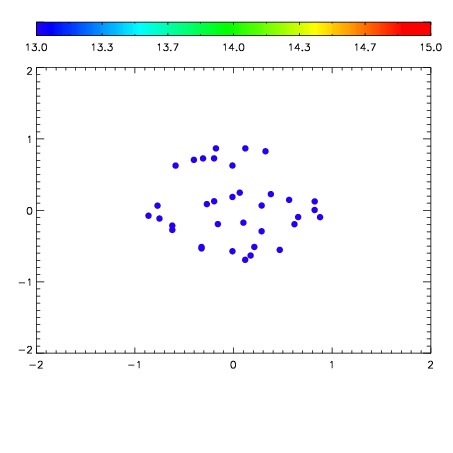

| Frame | Nreads | Zeropoints | Mag plots | Spatial mag deviation | Spatial sky 16325A emission deviations (filled: sky, open: star) | Spatial sky continuum emission | Spatial sky telluric CO2 absorption deviations (filled: H < 10) | |||||||||||||||||||||||
| 0 | 0 |
|
|
|
|
|
|
| IPAIR | NAME | SHIFT | NEWSHIFT | S/N | NAME | SHIFT | NEWSHIFT | S/N |
| 0 | 19120082 | 0.00230255 | 0.00000 | 18.9624 | 19120080 | -0.495393 | 0.497696 | 18.9469 |
| 1 | 19120081 | 0.00163653 | 0.000666020 | 18.8921 | 19120079 | -0.495258 | 0.497561 | 18.9153 |
| 2 | 19120078 | 0.00000 | 0.00230255 | 18.6585 | 19120083 | -0.494586 | 0.496889 | 18.8984 |