| Red | Green | Blue | |
| z | 17.64 | ||
| znorm | Inf | ||
| sky | -Inf | -NaN | -Inf |
| S/N | 30.4 | 48.2 | 56.6 |
| S/N(c) | 43.9 | 45.3 | 32.6 |
| SN(E/C) |
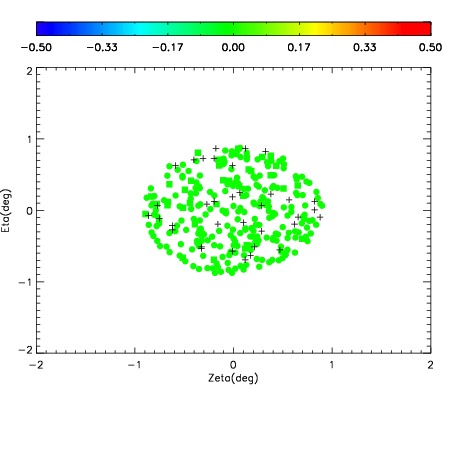
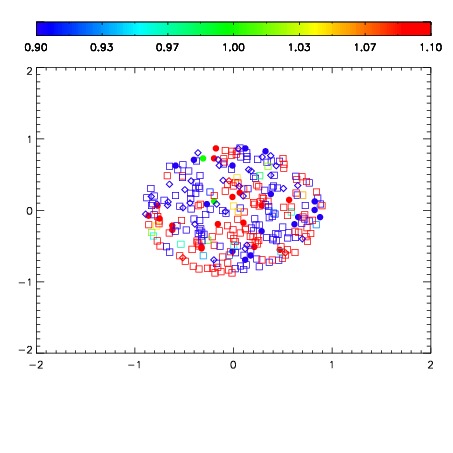
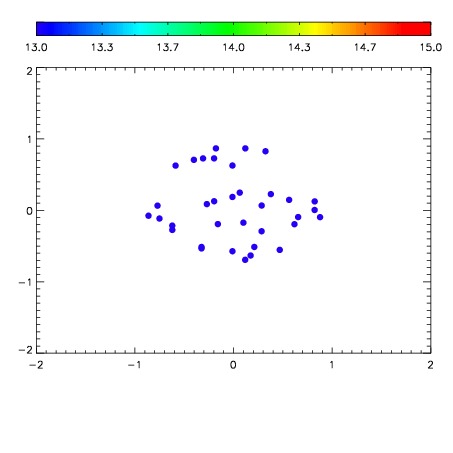

| Frame | Nreads | Zeropoints | Mag plots | Spatial mag deviation | Spatial sky 16325A emission deviations (filled: sky, open: star) | Spatial sky continuum emission | Spatial sky telluric CO2 absorption deviations (filled: H < 10) | |||||||||||||||||||||||
| 0 | 0 |
|
|
|
|
|
|
| IPAIR | NAME | SHIFT | NEWSHIFT | S/N | NAME | SHIFT | NEWSHIFT | S/N |
| 0 | 19910034 | 0.499539 | 0.00000 | 18.9009 | 19910029 | 0.00000 | 0.499539 | 18.8895 |
| 1 | 19910031 | 0.498228 | 0.00131097 | 18.9898 | 19910032 | 0.00413804 | 0.495401 | 18.9479 |
| 2 | 19910035 | 0.499499 | 3.99947e-05 | 18.9298 | 19910033 | 0.00446449 | 0.495075 | 18.9361 |
| 3 | 19910030 | 0.496180 | 0.00335899 | 18.9035 | 19910036 | 0.00246995 | 0.497069 | 18.8985 |