| Red | Green | Blue | |
| z | 17.64 | ||
| znorm | Inf | ||
| sky | -Inf | -Inf | -NaN |
| S/N | 32.2 | 51.0 | 58.5 |
| S/N(c) | 19.9 | 41.9 | 37.1 |
| SN(E/C) |
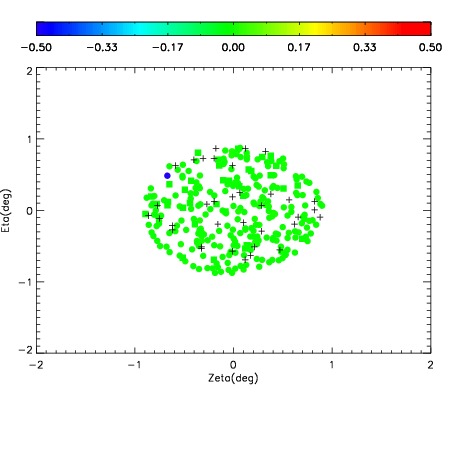
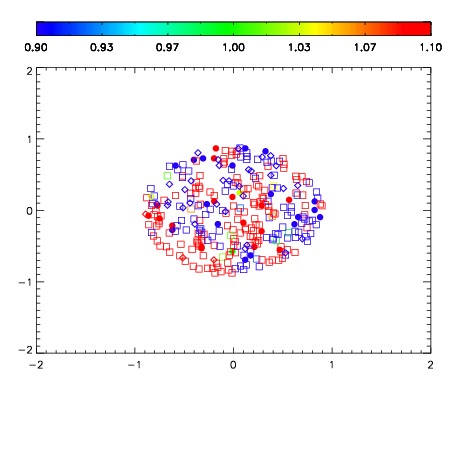
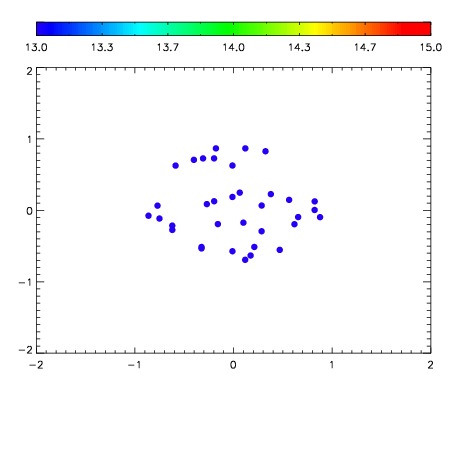

| Frame | Nreads | Zeropoints | Mag plots | Spatial mag deviation | Spatial sky 16325A emission deviations (filled: sky, open: star) | Spatial sky continuum emission | Spatial sky telluric CO2 absorption deviations (filled: H < 10) | |||||||||||||||||||||||
| 0 | 0 |
|
|
|
|
|
|
| IPAIR | NAME | SHIFT | NEWSHIFT | S/N | NAME | SHIFT | NEWSHIFT | S/N |
| 0 | 19940038 | 0.492853 | 0.00000 | 19.0875 | 19940036 | 0.00000 | 0.492853 | 19.1154 |
| 1 | 19940042 | 0.492841 | 1.19805e-05 | 19.1069 | 19940043 | -1.38900e-05 | 0.492867 | 19.1344 |
| 2 | 19940041 | 0.491332 | 0.00152099 | 19.0681 | 19940040 | 0.000198082 | 0.492655 | 19.0893 |
| 3 | 19940037 | 0.491922 | 0.000930995 | 19.0677 | 19940039 | -0.000101681 | 0.492955 | 19.0225 |