| Red | Green | Blue | |
| z | 17.64 | ||
| znorm | Inf | ||
| sky | -NaN | -NaN | -NaN |
| S/N | 20.6 | 37.4 | 43.5 |
| S/N(c) | 0.0 | 0.0 | 0.0 |
| SN(E/C) |

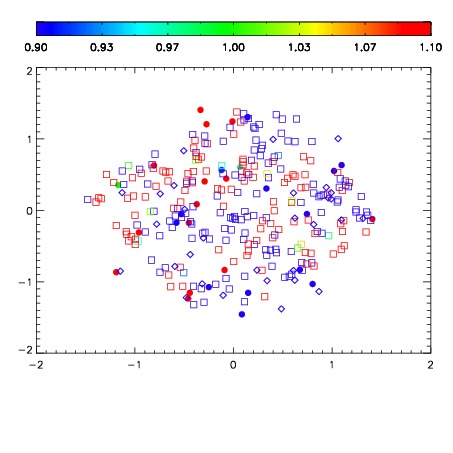


| Frame | Nreads | Zeropoints | Mag plots | Spatial mag deviation | Spatial sky 16325A emission deviations (filled: sky, open: star) | Spatial sky continuum emission | Spatial sky telluric CO2 absorption deviations (filled: H < 10) | |||||||||||||||||||||||
| 0 | 0 |
|
|
|
|
|
|
| IPAIR | NAME | SHIFT | NEWSHIFT | S/N | NAME | SHIFT | NEWSHIFT | S/N |
| 0 | 17020016 | 0.489480 | 0.00000 | 18.8073 | 17020017 | 0.00345697 | 0.486023 | 18.8187 |
| 1 | 17020015 | 0.488077 | 0.00140297 | 18.6262 | 17020010 | 0.00000 | 0.489480 | 18.6799 |
| 2 | 17020012 | 0.487389 | 0.00209099 | 18.5948 | 17020014 | 0.00211252 | 0.487367 | 18.6482 |
| 3 | 17020011 | 0.487314 | 0.00216600 | 18.4993 | 17020013 | 0.00184454 | 0.487635 | 18.6288 |