| Red | Green | Blue | |
| z | 17.64 | ||
| znorm | Inf | ||
| sky | -Inf | -NaN | -NaN |
| S/N | 16.6 | 29.9 | 33.8 |
| S/N(c) | 0.0 | 0.0 | 0.0 |
| SN(E/C) |
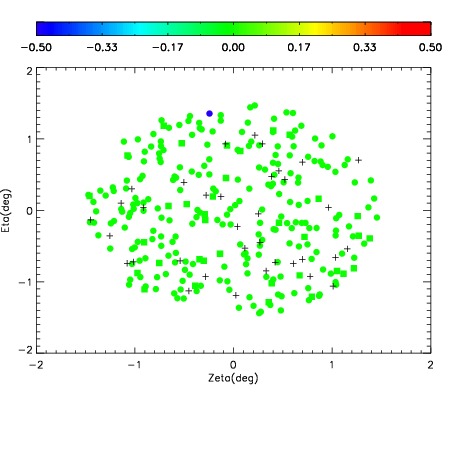
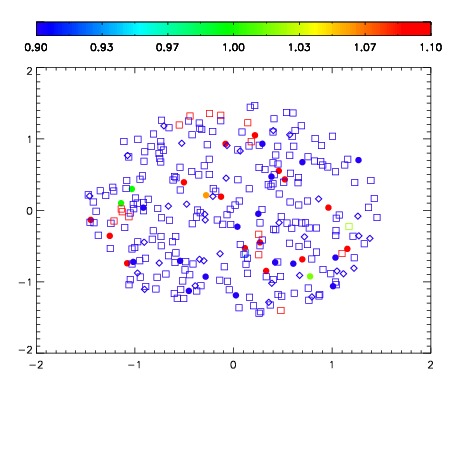
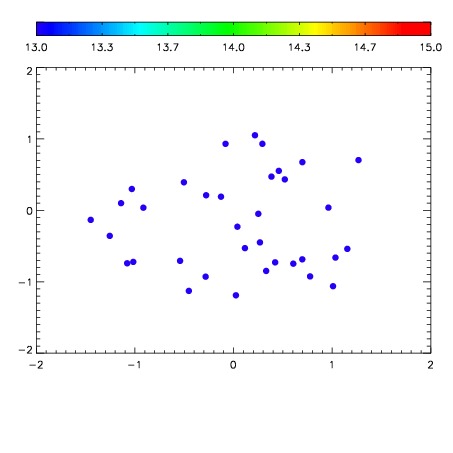

| Frame | Nreads | Zeropoints | Mag plots | Spatial mag deviation | Spatial sky 16325A emission deviations (filled: sky, open: star) | Spatial sky continuum emission | Spatial sky telluric CO2 absorption deviations (filled: H < 10) | |||||||||||||||||||||||
| 0 | 0 |
|
|
|
|
|
|
| IPAIR | NAME | SHIFT | NEWSHIFT | S/N | NAME | SHIFT | NEWSHIFT | S/N |
| 0 | 17480039 | 0.511783 | 0.00000 | 17.9258 | 17480038 | 0.00000 | 0.511783 | 18.0363 |
| 1 | 17480043 | 0.508462 | 0.00332099 | 18.7859 | 17480042 | -0.00265195 | 0.514435 | 18.7327 |
| 2 | 17480040 | 0.511249 | 0.000533998 | 18.1057 | 17480041 | -0.00201510 | 0.513798 | 18.1209 |