| Red | Green | Blue | |
| z | 17.64 | ||
| znorm | Inf | ||
| sky | -Inf | -Inf | -Inf |
| S/N | 15.5 | 28.4 | 32.4 |
| S/N(c) | 0.0 | 0.0 | 0.0 |
| SN(E/C) |
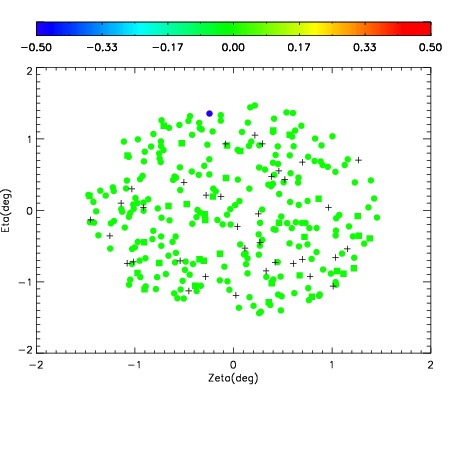
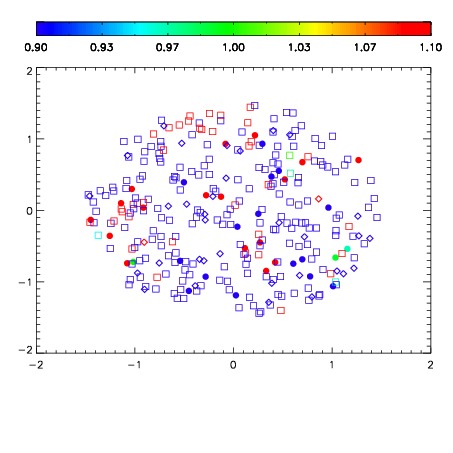
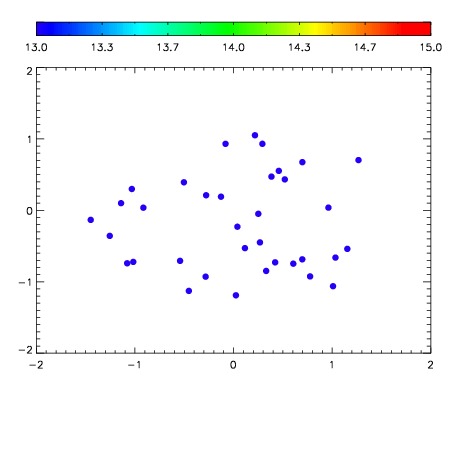

| Frame | Nreads | Zeropoints | Mag plots | Spatial mag deviation | Spatial sky 16325A emission deviations (filled: sky, open: star) | Spatial sky continuum emission | Spatial sky telluric CO2 absorption deviations (filled: H < 10) | |||||||||||||||||||||||
| 0 | 0 |
|
|
|
|
|
|
| IPAIR | NAME | SHIFT | NEWSHIFT | S/N | NAME | SHIFT | NEWSHIFT | S/N |
| 0 | 17500012 | 0.508993 | 0.00000 | 18.0903 | 17500011 | 0.00000 | 0.508993 | 18.0489 |
| 1 | 17500016 | 0.507427 | 0.00156605 | 18.4720 | 17500015 | 0.000196836 | 0.508796 | 18.5254 |
| 2 | 17500013 | 0.508461 | 0.000532031 | 18.1141 | 17500014 | 0.00109891 | 0.507894 | 18.0924 |