| Red | Green | Blue | |
| z | 17.64 | ||
| znorm | Inf | ||
| sky | -Inf | -Inf | -Inf |
| S/N | 22.3 | 41.5 | 46.4 |
| S/N(c) | 0.0 | 0.0 | 0.0 |
| SN(E/C) |

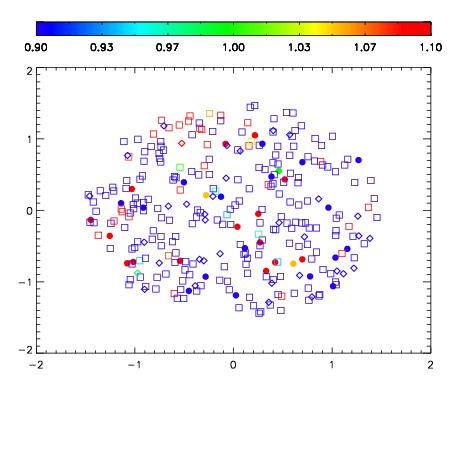
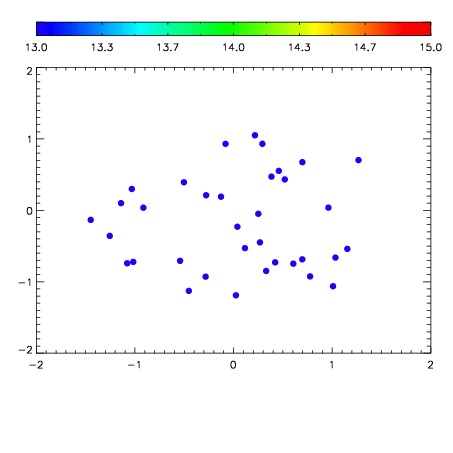

| Frame | Nreads | Zeropoints | Mag plots | Spatial mag deviation | Spatial sky 16325A emission deviations (filled: sky, open: star) | Spatial sky continuum emission | Spatial sky telluric CO2 absorption deviations (filled: H < 10) | |||||||||||||||||||||||
| 0 | 0 |
|
|
|
|
|
|
| IPAIR | NAME | SHIFT | NEWSHIFT | S/N | NAME | SHIFT | NEWSHIFT | S/N |
| 0 | 17700036 | 0.00261734 | 0.00000 | 18.3126 | 17700033 | -0.506305 | 0.508922 | 18.3117 |
| 1 | 17700039 | 0.00173841 | 0.000878930 | 18.5367 | 17700038 | -0.505027 | 0.507644 | 18.5374 |
| 2 | 17700032 | 0.00105754 | 0.00155980 | 18.4449 | 17700037 | -0.505986 | 0.508603 | 18.3216 |
| 3 | 17700035 | 0.00175034 | 0.000867000 | 18.1215 | 17700030 | -0.505287 | 0.507904 | 18.1322 |
| 4 | 17700028 | 0.00000 | 0.00261734 | 18.0707 | 17700034 | -0.506451 | 0.509068 | 18.0525 |
| 5 | 17700031 | 0.000691682 | 0.00192566 | 18.0217 | 17700029 | -0.505542 | 0.508159 | 17.8969 |