| Red | Green | Blue | |
| z | 17.64 | ||
| znorm | Inf | ||
| sky | -Inf | -Inf | -Inf |
| S/N | 19.1 | 34.7 | 37.3 |
| S/N(c) | 0.0 | 0.0 | 0.0 |
| SN(E/C) |
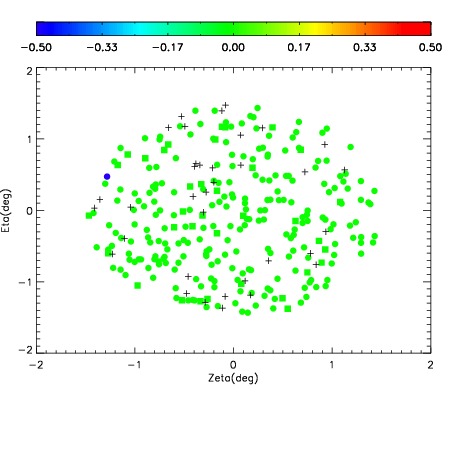
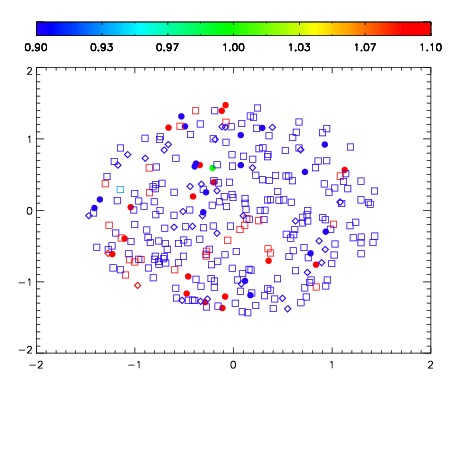
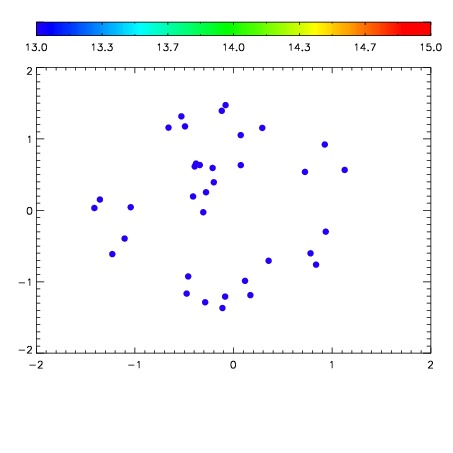

| Frame | Nreads | Zeropoints | Mag plots | Spatial mag deviation | Spatial sky 16325A emission deviations (filled: sky, open: star) | Spatial sky continuum emission | Spatial sky telluric CO2 absorption deviations (filled: H < 10) | |||||||||||||||||||||||
| 0 | 0 |
|
|
|
|
|
|
| IPAIR | NAME | SHIFT | NEWSHIFT | S/N | NAME | SHIFT | NEWSHIFT | S/N |
| 0 | 17460040 | 0.00141185 | 0.00000 | 18.6981 | 17460041 | -0.506361 | 0.507773 | 18.7726 |
| 1 | 17460043 | 0.000637060 | 0.000774790 | 18.2022 | 17460042 | -0.506276 | 0.507688 | 18.1006 |
| 2 | 17460036 | 0.00000 | 0.00141185 | 17.8953 | 17460037 | -0.511032 | 0.512444 | 17.9195 |
| 3 | 17460039 | 0.000973763 | 0.000438087 | 17.8528 | 17460038 | -0.510863 | 0.512275 | 17.7246 |