| Red | Green | Blue | |
| z | 17.64 | ||
| znorm | Inf | ||
| sky | -Inf | -Inf | -NaN |
| S/N | 12.9 | 24.3 | 26.0 |
| S/N(c) | 0.0 | 0.0 | 0.0 |
| SN(E/C) |
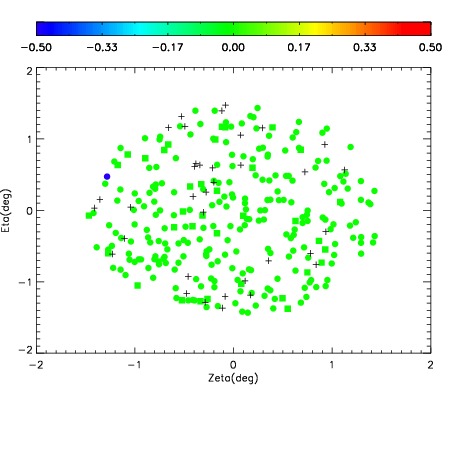
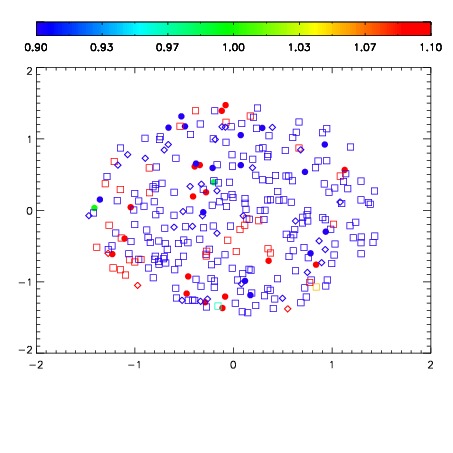
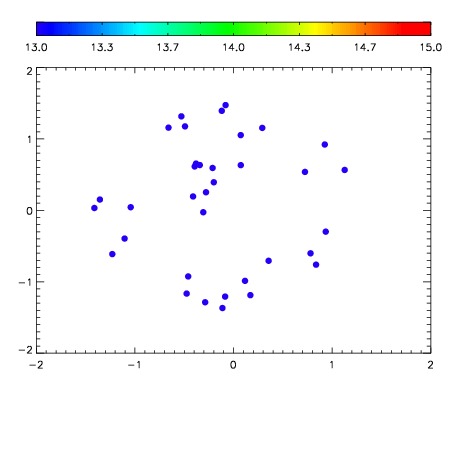

| Frame | Nreads | Zeropoints | Mag plots | Spatial mag deviation | Spatial sky 16325A emission deviations (filled: sky, open: star) | Spatial sky continuum emission | Spatial sky telluric CO2 absorption deviations (filled: H < 10) | |||||||||||||||||||||||
| 0 | 0 |
|
|
|
|
|
|
| IPAIR | NAME | SHIFT | NEWSHIFT | S/N | NAME | SHIFT | NEWSHIFT | S/N |
| 0 | 17470048 | 0.511157 | 0.00000 | 17.8266 | 17470047 | 0.00000 | 0.511157 | 17.8681 |
| 1 | 17470049 | 0.509754 | 0.00140297 | 18.8008 | 17470050 | 0.000171938 | 0.510985 | 18.7913 |
| 2 | 17470052 | 0.510789 | 0.000367999 | 17.9468 | 17470051 | 0.000288085 | 0.510869 | 17.9558 |