| Red | Green | Blue | |
| z | 17.64 | ||
| znorm | Inf | ||
| sky | -Inf | -Inf | -Inf |
| S/N | 14.5 | 29.3 | 30.4 |
| S/N(c) | 0.0 | 0.0 | 0.0 |
| SN(E/C) |
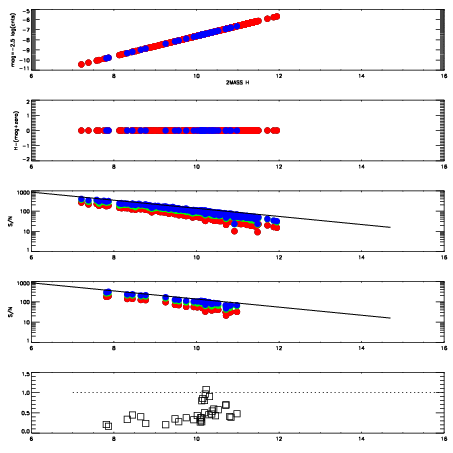
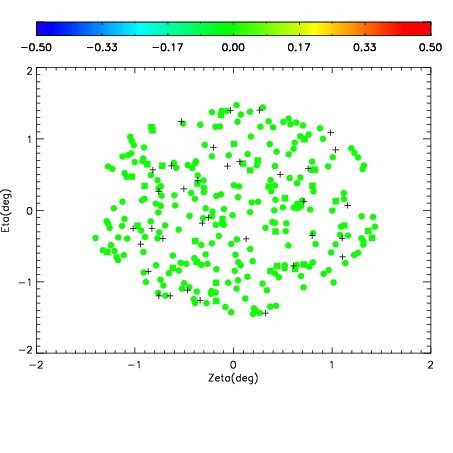
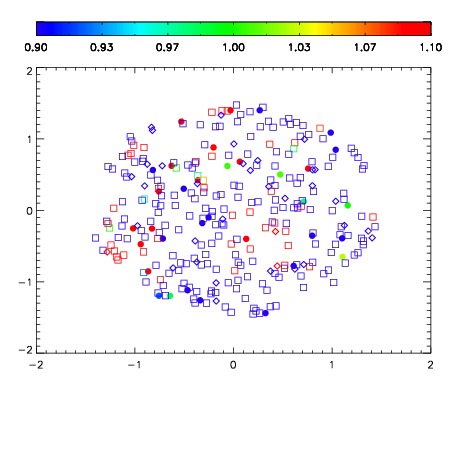
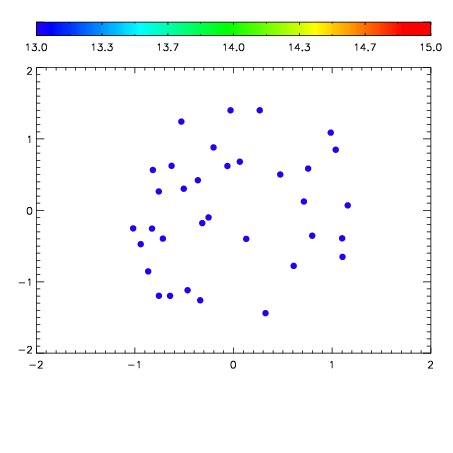

| Frame | Nreads | Zeropoints | Mag plots | Spatial mag deviation | Spatial sky 16325A emission deviations (filled: sky, open: star) | Spatial sky continuum emission | Spatial sky telluric CO2 absorption deviations (filled: H < 10) | |||||||||||||||||||||||
| 0 | 0 |
|
|
|
|
|
|
| IPAIR | NAME | SHIFT | NEWSHIFT | S/N | NAME | SHIFT | NEWSHIFT | S/N |
| 0 | 18370020 | 0.504314 | 0.00000 | 17.7469 | 18370018 | 0.00324990 | 0.501064 | 17.7093 |
| 1 | 18370016 | 0.501709 | 0.00260502 | 17.9556 | 18370022 | 0.00296258 | 0.501351 | 17.9504 |
| 2 | 18370021 | 0.504228 | 8.60095e-05 | 17.8920 | 18370015 | 0.00230688 | 0.502007 | 17.7614 |
| 3 | 18370012 | 0.502188 | 0.00212598 | 17.6295 | 18370019 | 0.00295286 | 0.501361 | 17.6107 |
| 4 | 18370017 | 0.502650 | 0.00166398 | 17.5731 | 18370011 | 0.00000 | 0.504314 | 17.5119 |
| 5 | 18370013 | 0.502578 | 0.00173599 | 17.4396 | 18370014 | 0.00233140 | 0.501983 | 17.3872 |