| Red | Green | Blue | |
| z | 17.64 | ||
| znorm | Inf | ||
| sky | -Inf | -Inf | -NaN |
| S/N | 23.1 | 42.6 | 45.6 |
| S/N(c) | 0.0 | 0.0 | 0.0 |
| SN(E/C) |
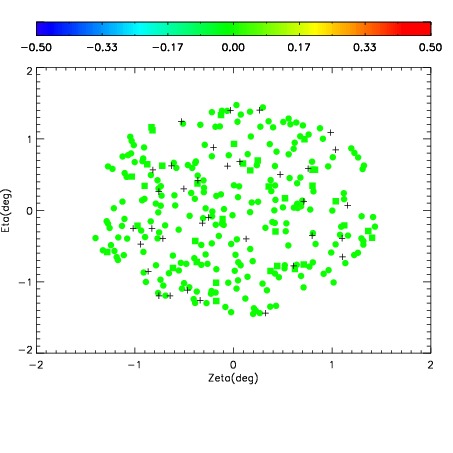
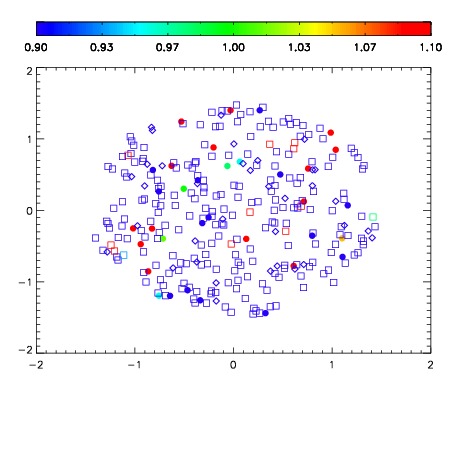
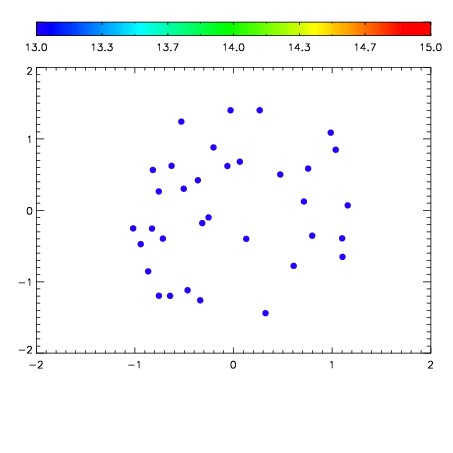

| Frame | Nreads | Zeropoints | Mag plots | Spatial mag deviation | Spatial sky 16325A emission deviations (filled: sky, open: star) | Spatial sky continuum emission | Spatial sky telluric CO2 absorption deviations (filled: H < 10) | |||||||||||||||||||||||
| 0 | 0 |
|
|
|
|
|
|
| IPAIR | NAME | SHIFT | NEWSHIFT | S/N | NAME | SHIFT | NEWSHIFT | S/N |
| 0 | 18380017 | 0.504991 | 0.00000 | 18.2801 | 18380018 | 0.00158905 | 0.503402 | 18.2891 |
| 1 | 18380016 | 0.504436 | 0.000554979 | 18.6485 | 18380015 | 0.00262498 | 0.502366 | 18.6657 |
| 2 | 18380021 | 0.502207 | 0.00278401 | 18.5765 | 18380022 | 0.00277620 | 0.502215 | 18.5257 |
| 3 | 18380020 | 0.502986 | 0.00200498 | 18.1877 | 18380019 | 0.00141939 | 0.503572 | 18.1460 |
| 4 | 18380012 | 0.504199 | 0.000791967 | 18.1647 | 18380011 | 0.00000 | 0.504991 | 18.1423 |
| 5 | 18380013 | 0.504649 | 0.000342011 | 17.9834 | 18380014 | 0.00259122 | 0.502400 | 18.0058 |