| Red | Green | Blue | |
| z | 17.64 | ||
| znorm | Inf | ||
| sky | -Inf | -Inf | -NaN |
| S/N | 30.6 | 46.3 | 53.4 |
| S/N(c) | 0.0 | 0.0 | 0.0 |
| SN(E/C) |
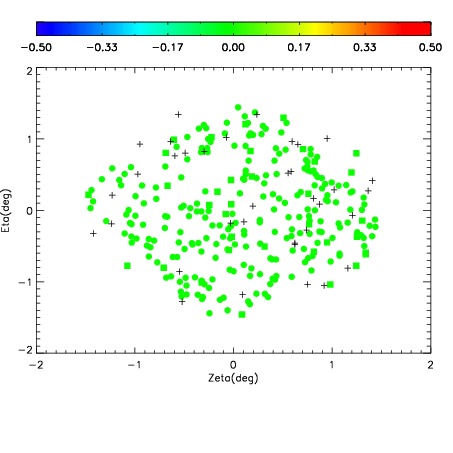
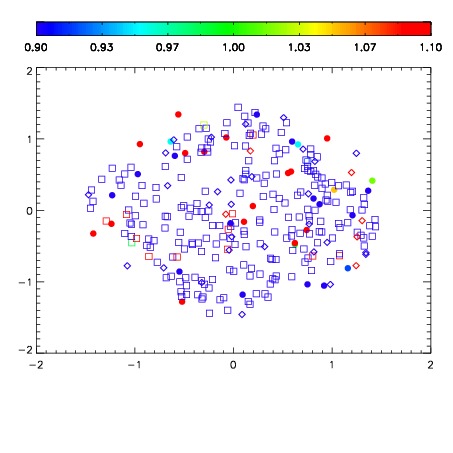
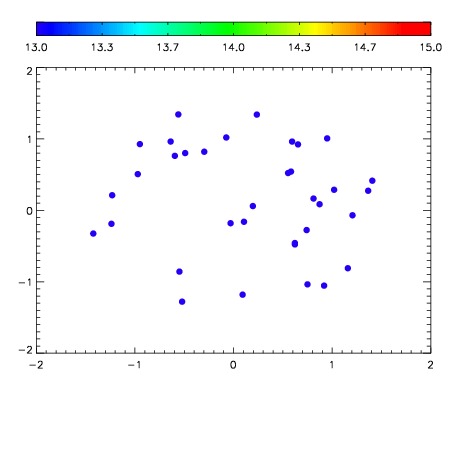

| Frame | Nreads | Zeropoints | Mag plots | Spatial mag deviation | Spatial sky 16325A emission deviations (filled: sky, open: star) | Spatial sky continuum emission | Spatial sky telluric CO2 absorption deviations (filled: H < 10) | |||||||||||||||||||||||
| 0 | 0 |
|
|
|
|
|
|
| IPAIR | NAME | SHIFT | NEWSHIFT | S/N | NAME | SHIFT | NEWSHIFT | S/N |
| 0 | 15790059 | 0.482399 | 0.00000 | 18.9578 | 15790061 | 0.000121762 | 0.482277 | 18.9108 |
| 1 | 15790060 | 0.481638 | 0.000760972 | 18.9629 | 15790062 | -0.000280460 | 0.482679 | 18.9777 |
| 2 | 15790063 | 0.478557 | 0.00384200 | 18.9370 | 15790065 | -0.000570907 | 0.482970 | 18.8749 |
| 3 | 15790064 | 0.479506 | 0.00289300 | 18.8427 | 15790058 | 0.00000 | 0.482399 | 18.8318 |