| Red | Green | Blue | |
| z | 17.64 | ||
| znorm | Inf | ||
| sky | -Inf | -Inf | -Inf |
| S/N | 22.6 | 37.7 | 42.5 |
| S/N(c) | 33.3 | 44.4 | 27.5 |
| SN(E/C) |
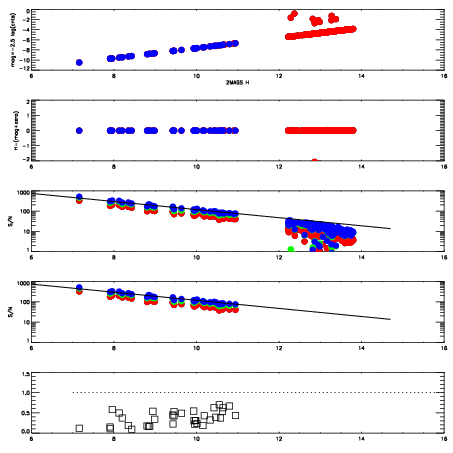


| Frame | Nreads | Zeropoints | Mag plots | Spatial mag deviation | Spatial sky 16325A emission deviations (filled: sky, open: star) | Spatial sky continuum emission | Spatial sky telluric CO2 absorption deviations (filled: H < 10) | |||||||||||||||||||||||
| 0 | 0 |
|
|
|
|
|
|
| IPAIR | NAME | SHIFT | NEWSHIFT | S/N | NAME | SHIFT | NEWSHIFT | S/N |
| 0 | 16070035 | 0.491592 | 0.00000 | 18.5320 | 16070037 | 0.00185561 | 0.489736 | 18.7879 |
| 1 | 16070038 | 0.491193 | 0.000398993 | 18.3611 | 16070040 | 0.00164003 | 0.489952 | 18.5343 |
| 2 | 16070039 | 0.491430 | 0.000161976 | 18.2032 | 16070033 | 0.00000 | 0.491592 | 18.0509 |
| 3 | 16070034 | 0.490752 | 0.000839978 | 18.0830 | 16070036 | 0.00251323 | 0.489079 | 17.6807 |