| Red | Green | Blue | |
| z | 17.64 | ||
| znorm | Inf | ||
| sky | -Inf | -Inf | -NaN |
| S/N | 42.5 | 61.0 | 75.9 |
| S/N(c) | 51.2 | 65.2 | 41.6 |
| SN(E/C) |
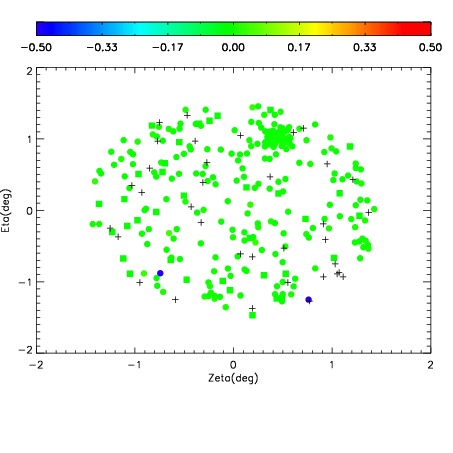
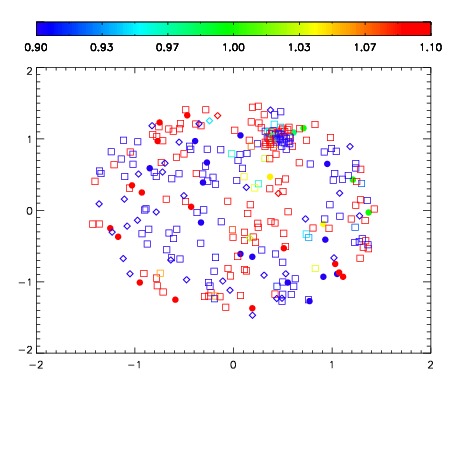


| Frame | Nreads | Zeropoints | Mag plots | Spatial mag deviation | Spatial sky 16325A emission deviations (filled: sky, open: star) | Spatial sky continuum emission | Spatial sky telluric CO2 absorption deviations (filled: H < 10) | |||||||||||||||||||||||
| 0 | 0 |
|
|
|
|
|
|
| IPAIR | NAME | SHIFT | NEWSHIFT | S/N | NAME | SHIFT | NEWSHIFT | S/N |
| 0 | 15810051 | 0.485740 | 0.00000 | 19.0665 | 15810050 | 0.00000 | 0.485740 | 19.0403 |
| 1 | 15810055 | 0.485668 | 7.20024e-05 | 19.1339 | 15810054 | 0.000855836 | 0.484884 | 19.1350 |
| 2 | 15810059 | 0.484354 | 0.00138602 | 19.1266 | 15810058 | 0.000747767 | 0.484992 | 19.0923 |
| 3 | 15810056 | 0.485215 | 0.000524998 | 19.1106 | 15810053 | 0.000678779 | 0.485061 | 19.0918 |
| 4 | 15810052 | 0.485652 | 8.80063e-05 | 19.0696 | 15810057 | 0.000787108 | 0.484953 | 19.0535 |