| Red | Green | Blue | |
| z | 17.64 | ||
| znorm | Inf | ||
| sky | -Inf | -Inf | -Inf |
| S/N | 30.6 | 43.3 | 55.4 |
| S/N(c) | 34.6 | 44.4 | 29.0 |
| SN(E/C) |
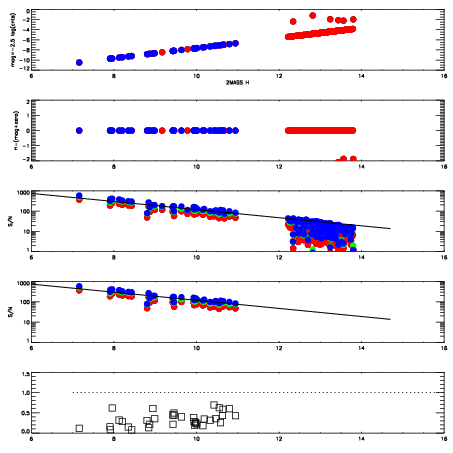
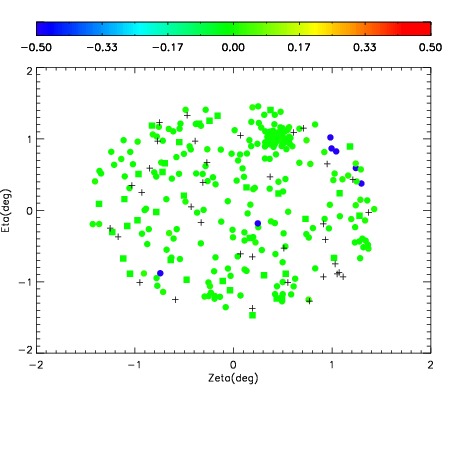
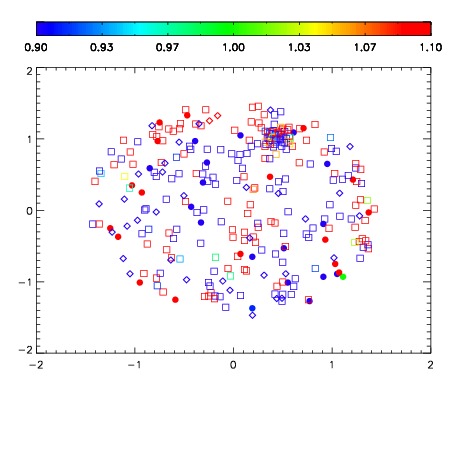
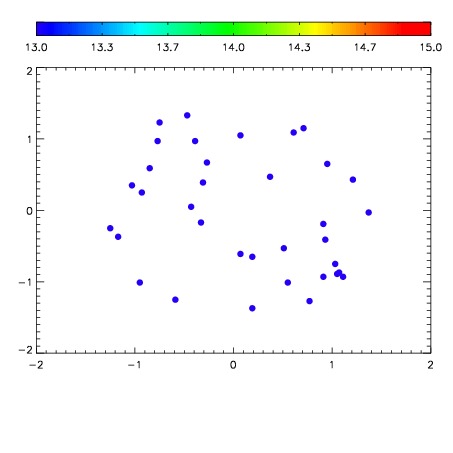

| Frame | Nreads | Zeropoints | Mag plots | Spatial mag deviation | Spatial sky 16325A emission deviations (filled: sky, open: star) | Spatial sky continuum emission | Spatial sky telluric CO2 absorption deviations (filled: H < 10) | |||||||||||||||||||||||
| 0 | 0 |
|
|
|
|
|
|
| IPAIR | NAME | SHIFT | NEWSHIFT | S/N | NAME | SHIFT | NEWSHIFT | S/N |
| 0 | 15860038 | 0.489709 | 0.00000 | 18.7578 | 15860037 | 0.00194614 | 0.487763 | 18.7353 |
| 1 | 15860039 | 0.489490 | 0.000218987 | 18.7176 | 15860040 | -0.000191241 | 0.489900 | 18.6929 |
| 2 | 15860034 | 0.489648 | 6.09756e-05 | 18.6518 | 15860033 | 0.00000 | 0.489709 | 18.5542 |
| 3 | 15860035 | 0.489371 | 0.000337988 | 17.9157 | 15860036 | 0.00100517 | 0.488704 | 17.4900 |