| Red | Green | Blue | |
| z | 17.64 | ||
| znorm | Inf | ||
| sky | -Inf | -Inf | -Inf |
| S/N | 31.9 | 46.6 | 57.9 |
| S/N(c) | 32.6 | 56.4 | 35.2 |
| SN(E/C) |
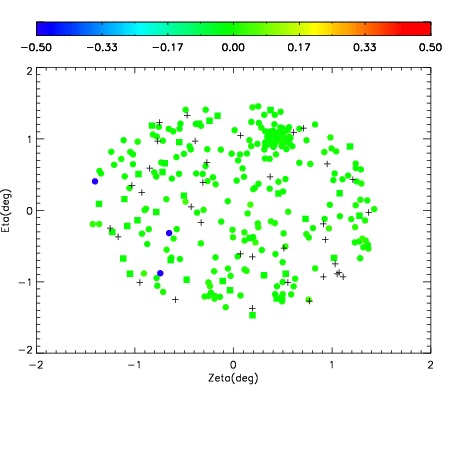
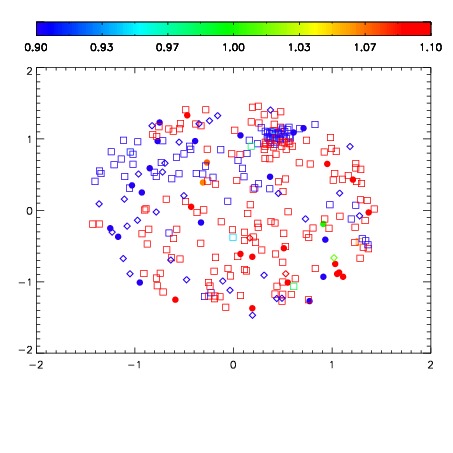


| Frame | Nreads | Zeropoints | Mag plots | Spatial mag deviation | Spatial sky 16325A emission deviations (filled: sky, open: star) | Spatial sky continuum emission | Spatial sky telluric CO2 absorption deviations (filled: H < 10) | |||||||||||||||||||||||
| 0 | 0 |
|
|
|
|
|
|
| IPAIR | NAME | SHIFT | NEWSHIFT | S/N | NAME | SHIFT | NEWSHIFT | S/N |
| 0 | 16090036 | 0.494709 | 0.00000 | 18.8702 | 16090034 | 0.00000 | 0.494709 | 18.8257 |
| 1 | 16090035 | 0.493290 | 0.00141901 | 18.8546 | 16090037 | 0.00245011 | 0.492259 | 18.8126 |
| 2 | 16090040 | 0.494630 | 7.90060e-05 | 18.6111 | 16090038 | 0.00310960 | 0.491599 | 18.7011 |
| 3 | 16090039 | 0.494668 | 4.10080e-05 | 18.5597 | 16090041 | 0.00443910 | 0.490270 | 18.6171 |