| Red | Green | Blue | |
| z | 17.64 | ||
| znorm | Inf | ||
| sky | -Inf | -Inf | -Inf |
| S/N | 22.1 | 42.2 | 44.5 |
| S/N(c) | 0.0 | 0.0 | 0.0 |
| SN(E/C) |
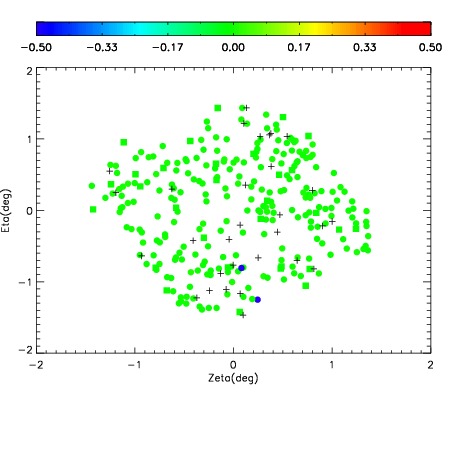
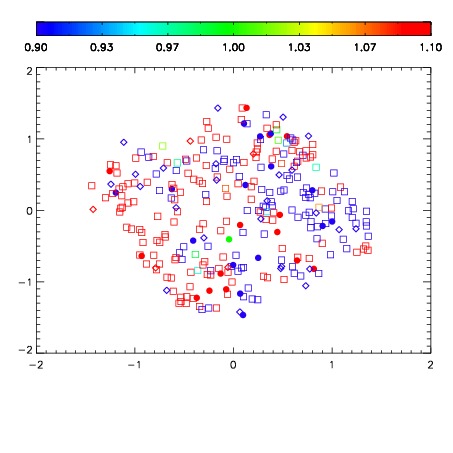
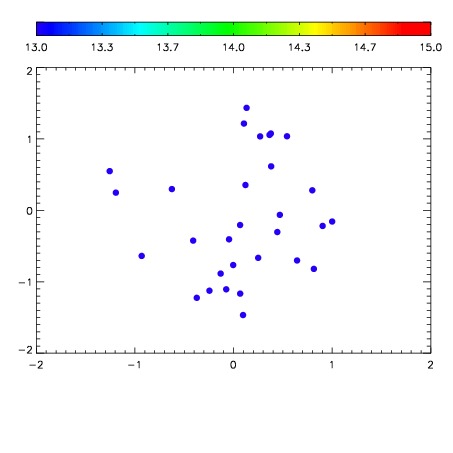

| Frame | Nreads | Zeropoints | Mag plots | Spatial mag deviation | Spatial sky 16325A emission deviations (filled: sky, open: star) | Spatial sky continuum emission | Spatial sky telluric CO2 absorption deviations (filled: H < 10) | |||||||||||||||||||||||
| 0 | 0 |
|
|
|
|
|
|
| IPAIR | NAME | SHIFT | NEWSHIFT | S/N | NAME | SHIFT | NEWSHIFT | S/N |
| 0 | 16100033 | 0.497221 | 0.00000 | 18.7019 | 16100038 | 0.00204260 | 0.495178 | 18.6061 |
| 1 | 16100036 | 0.495836 | 0.00138500 | 18.8447 | 16100035 | 0.000236613 | 0.496984 | 18.7981 |
| 2 | 16100037 | 0.496953 | 0.000267982 | 18.7232 | 16100034 | 0.00107602 | 0.496145 | 18.6753 |
| 3 | 16100032 | 0.496601 | 0.000620008 | 18.6579 | 16100031 | 0.00000 | 0.497221 | 18.5975 |