| Red | Green | Blue | |
| z | 17.64 | ||
| znorm | Inf | ||
| sky | -Inf | -NaN | -Inf |
| S/N | 30.0 | 53.7 | 58.5 |
| S/N(c) | 0.0 | 0.0 | 0.0 |
| SN(E/C) |
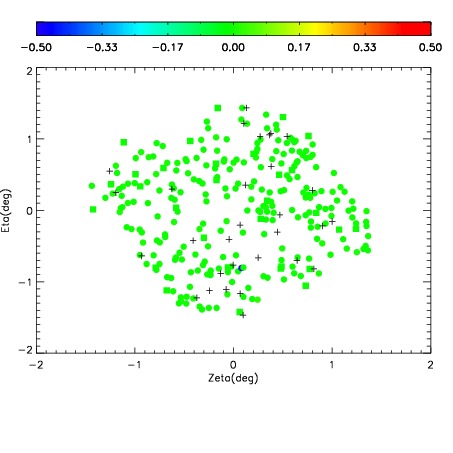
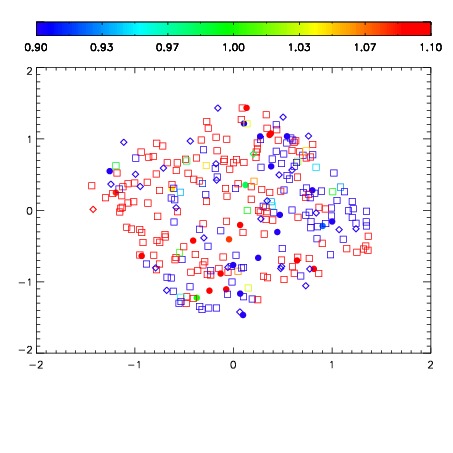
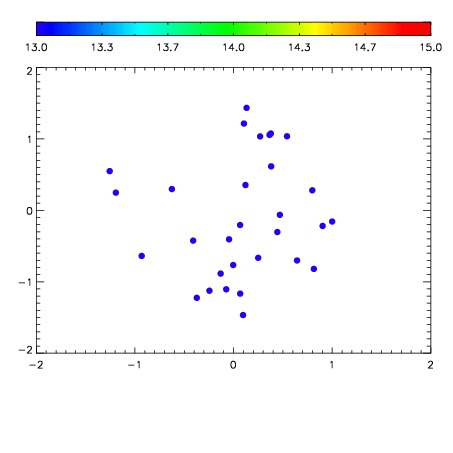

| Frame | Nreads | Zeropoints | Mag plots | Spatial mag deviation | Spatial sky 16325A emission deviations (filled: sky, open: star) | Spatial sky continuum emission | Spatial sky telluric CO2 absorption deviations (filled: H < 10) | |||||||||||||||||||||||
| 0 | 0 |
|
|
|
|
|
|
| IPAIR | NAME | SHIFT | NEWSHIFT | S/N | NAME | SHIFT | NEWSHIFT | S/N |
| 0 | 16120013 | 0.496777 | 0.00000 | 19.1402 | 16120015 | -0.000720278 | 0.497497 | 19.1604 |
| 1 | 16120012 | 0.496631 | 0.000146002 | 19.2010 | 16120011 | 0.00000 | 0.496777 | 19.1805 |
| 2 | 16120017 | 0.494617 | 0.00216001 | 19.1081 | 16120014 | -0.000612826 | 0.497390 | 19.1535 |
| 3 | 16120016 | 0.495604 | 0.00117299 | 19.0562 | 16120018 | -0.00129347 | 0.498070 | 19.1218 |