| Red | Green | Blue | |
| z | 17.64 | ||
| znorm | Inf | ||
| sky | -Inf | -Inf | -Inf |
| S/N | 22.2 | 40.9 | 44.2 |
| S/N(c) | 0.0 | 0.0 | 0.0 |
| SN(E/C) |
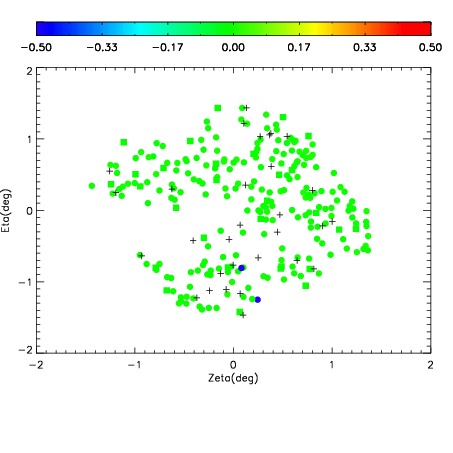
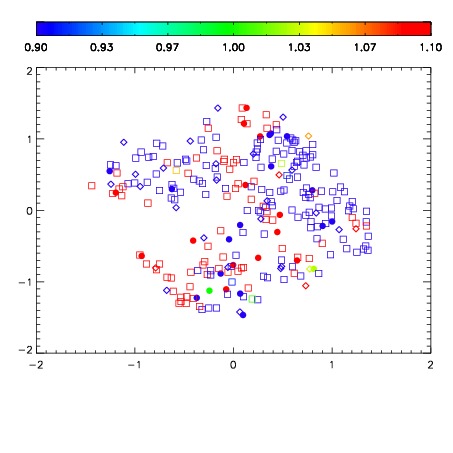


| Frame | Nreads | Zeropoints | Mag plots | Spatial mag deviation | Spatial sky 16325A emission deviations (filled: sky, open: star) | Spatial sky continuum emission | Spatial sky telluric CO2 absorption deviations (filled: H < 10) | |||||||||||||||||||||||
| 0 | 0 |
|
|
|
|
|
|
| IPAIR | NAME | SHIFT | NEWSHIFT | S/N | NAME | SHIFT | NEWSHIFT | S/N |
| 0 | 16160031 | 0.492532 | 0.00000 | 18.5221 | 16160029 | 0.00106582 | 0.491466 | 18.6731 |
| 1 | 16160030 | 0.491553 | 0.000979006 | 18.8068 | 16160025 | 0.00000 | 0.492532 | 18.8447 |
| 2 | 16160026 | 0.490456 | 0.00207600 | 18.7880 | 16160032 | 0.000165985 | 0.492366 | 18.7232 |
| 3 | 16160027 | 0.491391 | 0.00114101 | 18.5043 | 16160028 | 0.00111435 | 0.491418 | 18.5748 |