| Red | Green | Blue | |
| z | 17.64 | ||
| znorm | Inf | ||
| sky | -Inf | -Inf | -Inf |
| S/N | 26.0 | 49.4 | 56.6 |
| S/N(c) | 0.0 | 0.0 | 0.0 |
| SN(E/C) |
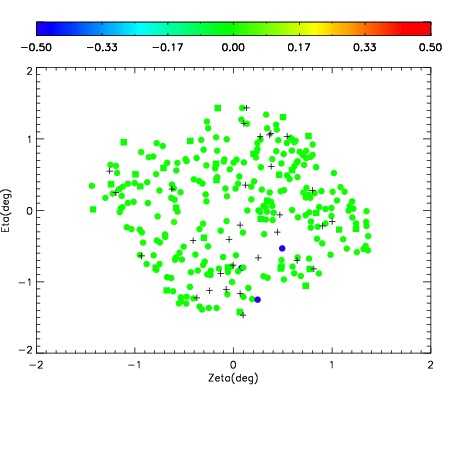
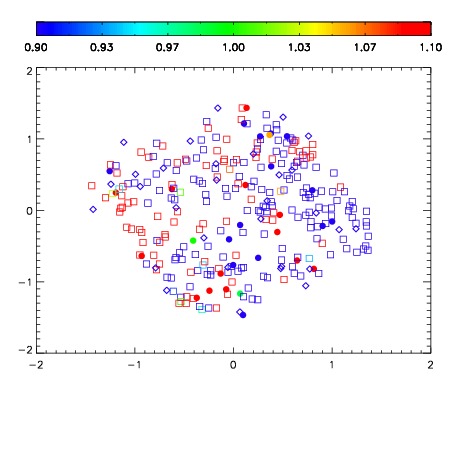
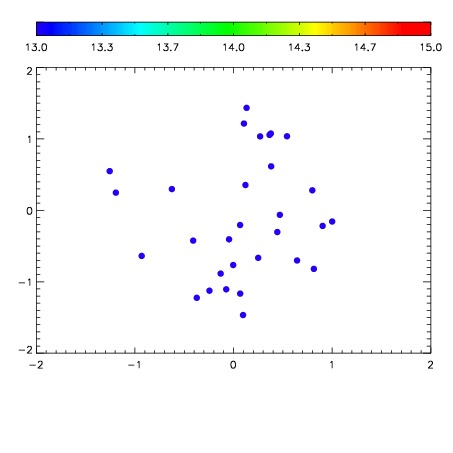

| Frame | Nreads | Zeropoints | Mag plots | Spatial mag deviation | Spatial sky 16325A emission deviations (filled: sky, open: star) | Spatial sky continuum emission | Spatial sky telluric CO2 absorption deviations (filled: H < 10) | |||||||||||||||||||||||
| 0 | 0 |
|
|
|
|
|
|
| IPAIR | NAME | SHIFT | NEWSHIFT | S/N | NAME | SHIFT | NEWSHIFT | S/N |
| 0 | 19340060 | 0.488313 | 0.00000 | 18.7781 | 19340062 | -0.000767837 | 0.489081 | 18.7730 |
| 1 | 19340065 | 0.486086 | 0.00222698 | 18.8931 | 19340067 | -0.00118156 | 0.489495 | 18.8783 |
| 2 | 19340064 | 0.486692 | 0.00162098 | 18.8760 | 19340066 | -5.73305e-05 | 0.488370 | 18.8626 |
| 3 | 19340068 | 0.485211 | 0.00310197 | 18.8548 | 19340063 | -0.00173112 | 0.490044 | 18.7860 |
| 4 | 19340061 | 0.488124 | 0.000188977 | 18.8095 | 19340059 | 0.00000 | 0.488313 | 18.7742 |