| Red | Green | Blue | |
| z | 17.64 | ||
| znorm | Inf | ||
| sky | -Inf | -NaN | -Inf |
| S/N | 31.6 | 55.8 | 62.3 |
| S/N(c) | 0.0 | 0.0 | 0.0 |
| SN(E/C) |
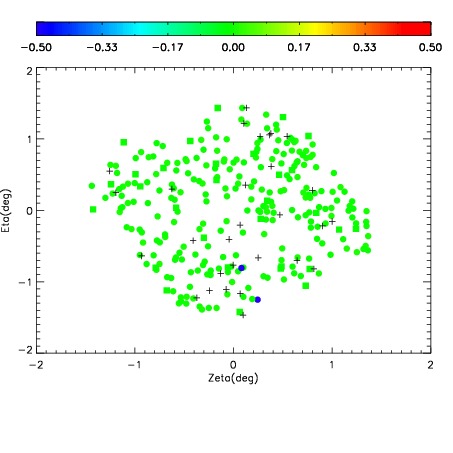
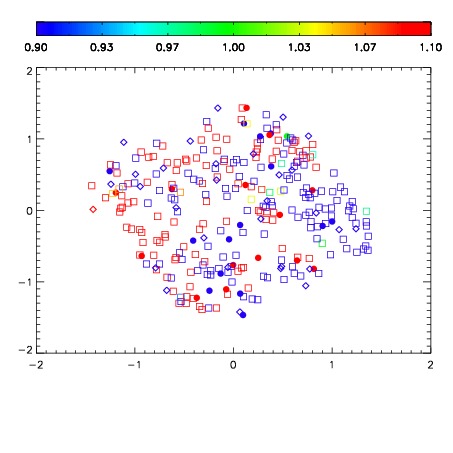


| Frame | Nreads | Zeropoints | Mag plots | Spatial mag deviation | Spatial sky 16325A emission deviations (filled: sky, open: star) | Spatial sky continuum emission | Spatial sky telluric CO2 absorption deviations (filled: H < 10) | |||||||||||||||||||||||
| 0 | 0 |
|
|
|
|
|
|
| IPAIR | NAME | SHIFT | NEWSHIFT | S/N | NAME | SHIFT | NEWSHIFT | S/N |
| 0 | 19660065 | 0.00000 | 0.00000 | 19.1840 | 19660071 | -0.494240 | 0.494240 | 19.1802 |
| 1 | 19660069 | -0.000701631 | 0.000701631 | 19.2076 | 19660067 | -0.488452 | 0.488452 | 19.1967 |
| 2 | 19660068 | -0.000450675 | 0.000450675 | 19.1777 | 19660070 | -0.493972 | 0.493972 | 19.1699 |
| 3 | 19660072 | -0.000605945 | 0.000605945 | 19.1379 | 19660066 | -0.488696 | 0.488696 | 19.1576 |