| Red | Green | Blue | |
| z | 17.64 | ||
| znorm | Inf | ||
| sky | -Inf | -Inf | -Inf |
| S/N | 28.1 | 50.6 | 56.9 |
| S/N(c) | 0.0 | 0.0 | 0.0 |
| SN(E/C) |
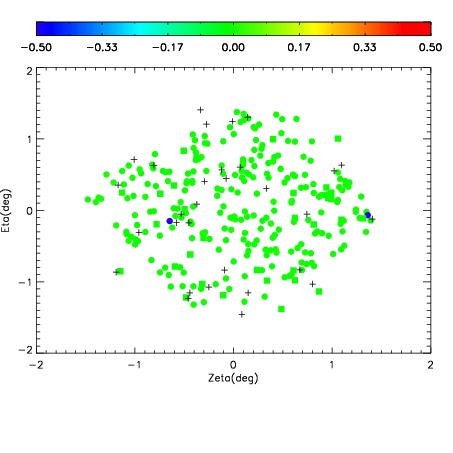
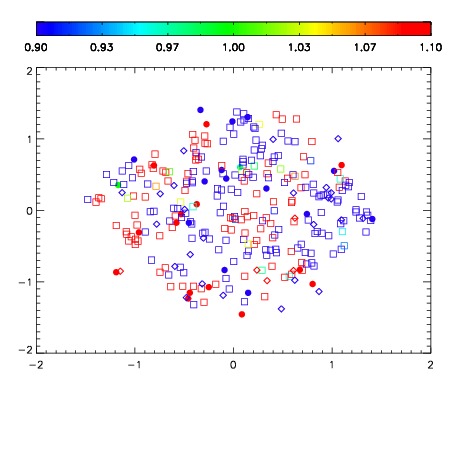
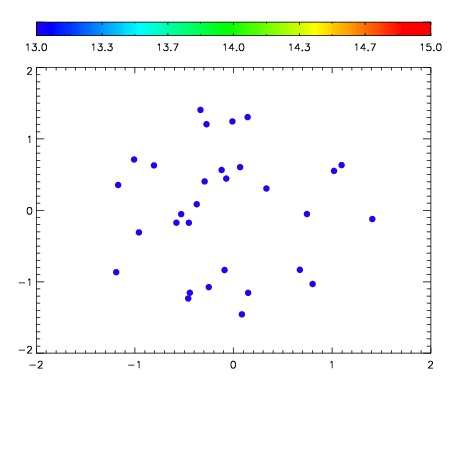

| Frame | Nreads | Zeropoints | Mag plots | Spatial mag deviation | Spatial sky 16325A emission deviations (filled: sky, open: star) | Spatial sky continuum emission | Spatial sky telluric CO2 absorption deviations (filled: H < 10) | |||||||||||||||||||||||
| 0 | 0 |
|
|
|
|
|
|
| IPAIR | NAME | SHIFT | NEWSHIFT | S/N | NAME | SHIFT | NEWSHIFT | S/N |
| 0 | 15800057 | 0.486138 | 0.00000 | 18.7478 | 15800056 | 0.00000 | 0.486138 | 18.7130 |
| 1 | 15800065 | 0.484470 | 0.00166798 | 19.0498 | 15800064 | -7.45791e-05 | 0.486213 | 19.1412 |
| 2 | 15800061 | 0.485187 | 0.000950992 | 18.9927 | 15800063 | 0.000611885 | 0.485526 | 19.0364 |
| 3 | 15800058 | 0.485962 | 0.000175983 | 18.9736 | 15800059 | 0.000979925 | 0.485158 | 18.8994 |
| 4 | 15800062 | 0.485653 | 0.000484973 | 18.9318 | 15800060 | 0.000868897 | 0.485269 | 18.7258 |