| Red | Green | Blue | |
| z | 17.64 | ||
| znorm | Inf | ||
| sky | -Inf | -Inf | -Inf |
| S/N | 12.7 | 24.8 | 28.7 |
| S/N(c) | 0.0 | 0.0 | 0.0 |
| SN(E/C) |
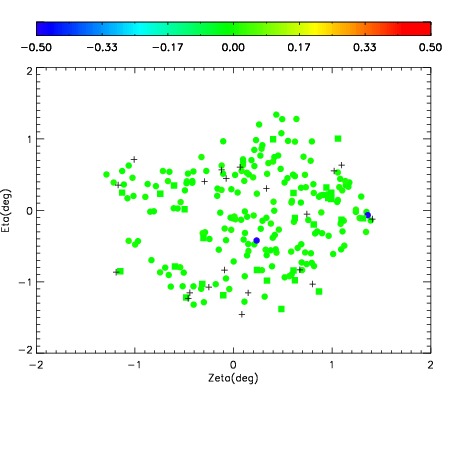

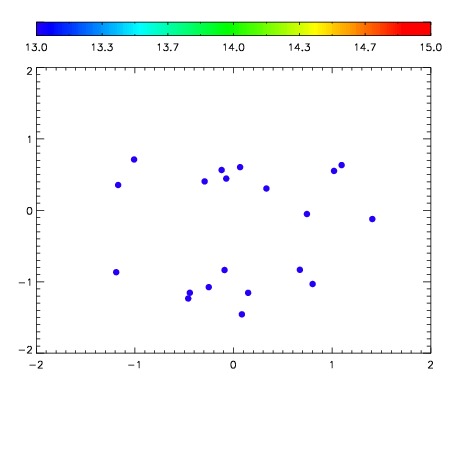

| Frame | Nreads | Zeropoints | Mag plots | Spatial mag deviation | Spatial sky 16325A emission deviations (filled: sky, open: star) | Spatial sky continuum emission | Spatial sky telluric CO2 absorption deviations (filled: H < 10) | |||||||||||||||||||||||
| 0 | 0 |
|
|
|
|
|
|
| IPAIR | NAME | SHIFT | NEWSHIFT | S/N | NAME | SHIFT | NEWSHIFT | S/N |
| 0 | 16370017 | 0.490195 | 0.00000 | 16.9796 | 16370018 | 7.52069e-05 | 0.490120 | 16.0181 |
| 1 | 16370012 | 0.488227 | 0.00196800 | 18.4033 | 16370014 | -0.000739811 | 0.490935 | 18.5535 |
| 2 | 16370016 | 0.488488 | 0.00170702 | 18.3667 | 16370011 | 0.00000 | 0.490195 | 18.2944 |
| 3 | 16370013 | 0.487817 | 0.00237802 | 18.2309 | 16370015 | 0.000158485 | 0.490037 | 17.4649 |