| Red | Green | Blue | |
| z | 17.64 | ||
| znorm | Inf | ||
| sky | -Inf | -Inf | -Inf |
| S/N | 32.5 | 48.4 | 59.2 |
| S/N(c) | 47.8 | 16.1 | 61.3 |
| SN(E/C) |
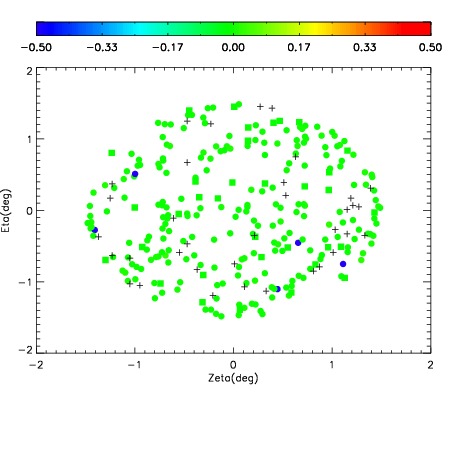
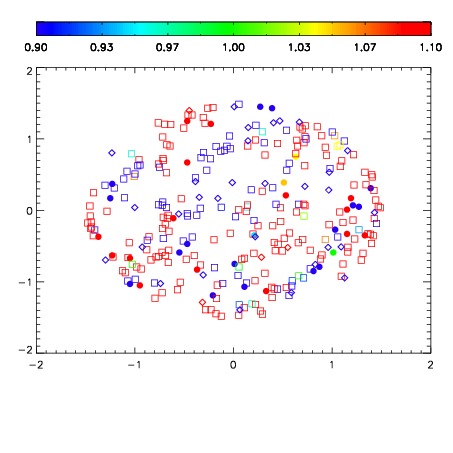
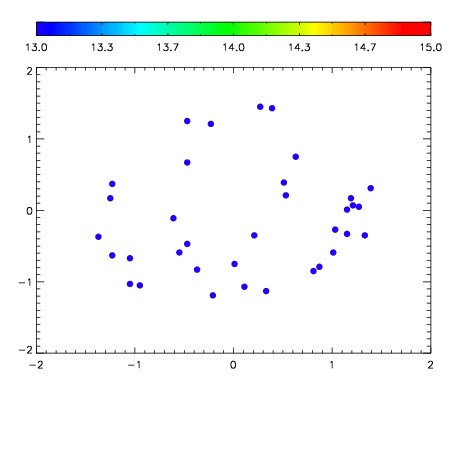

| Frame | Nreads | Zeropoints | Mag plots | Spatial mag deviation | Spatial sky 16325A emission deviations (filled: sky, open: star) | Spatial sky continuum emission | Spatial sky telluric CO2 absorption deviations (filled: H < 10) | |||||||||||||||||||||||
| 0 | 0 |
|
|
|
|
|
|
| IPAIR | NAME | SHIFT | NEWSHIFT | S/N | NAME | SHIFT | NEWSHIFT | S/N |
| 0 | 15800051 | 0.485033 | 0.00000 | 18.7854 | 15800052 | -0.000624407 | 0.485657 | 18.8745 |
| 1 | 15800047 | 0.483513 | 0.00152001 | 18.8952 | 15800049 | -0.000722548 | 0.485756 | 18.9131 |
| 2 | 15800050 | 0.484295 | 0.000737995 | 18.8749 | 15800045 | 0.00000 | 0.485033 | 18.9022 |
| 3 | 15800046 | 0.483204 | 0.00182900 | 18.8166 | 15800048 | -0.000431690 | 0.485465 | 18.8782 |