| Red | Green | Blue | |
| z | 17.55 | ||
| znorm | Inf | ||
| sky | -NaN | -NaN | -NaN |
| S/N | 26.5 | 42.8 | 48.2 |
| S/N(c) | 34.2 | 45.7 | 43.1 |
| SN(E/C) |
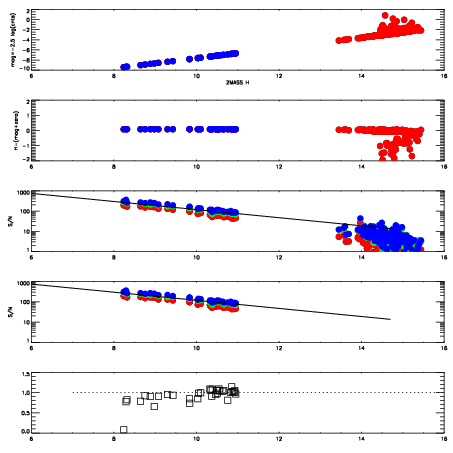

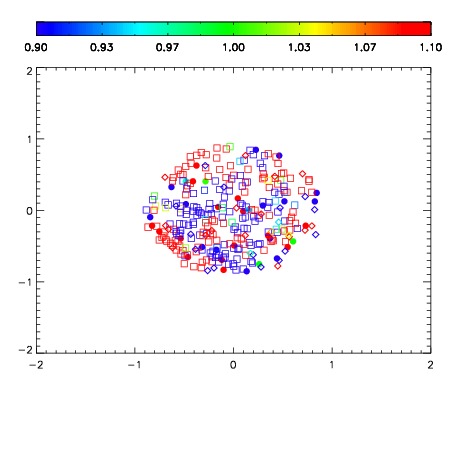
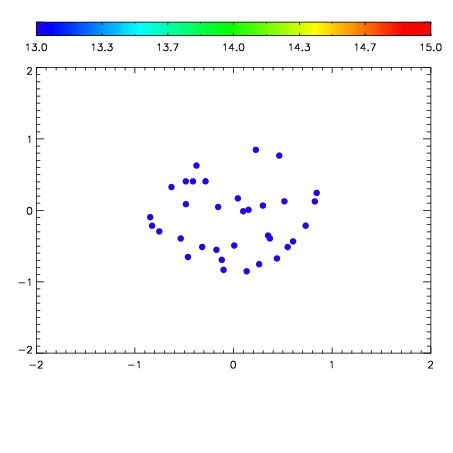

| Frame | Nreads | Zeropoints | Mag plots | Spatial mag deviation | Spatial sky 16325A emission deviations (filled: sky, open: star) | Spatial sky continuum emission | Spatial sky telluric CO2 absorption deviations (filled: H < 10) | |||||||||||||||||||||||
| 0 | 0 |
|
|
|
|
|
|
| IPAIR | NAME | SHIFT | NEWSHIFT | S/N | NAME | SHIFT | NEWSHIFT | S/N |
| 0 | 15800073 | 0.00155229 | 0.00000 | 18.7046 | 15800074 | -0.484369 | 0.485921 | 18.6794 |
| 1 | 15800076 | 0.000723008 | 0.000829282 | 18.7130 | 15800070 | -0.485128 | 0.486680 | 18.6974 |
| 2 | 15800072 | 0.00113434 | 0.000417950 | 18.6864 | 15800075 | -0.484438 | 0.485990 | 18.6641 |
| 3 | 15800069 | 0.00000 | 0.00155229 | 18.5224 | 15800071 | -0.485202 | 0.486754 | 18.6508 |