| Red | Green | Blue | |
| z | 17.64 | ||
| znorm | Inf | ||
| sky | -Inf | -Inf | -Inf |
| S/N | 23.7 | 42.8 | 48.5 |
| S/N(c) | 0.0 | 0.0 | 0.0 |
| SN(E/C) |
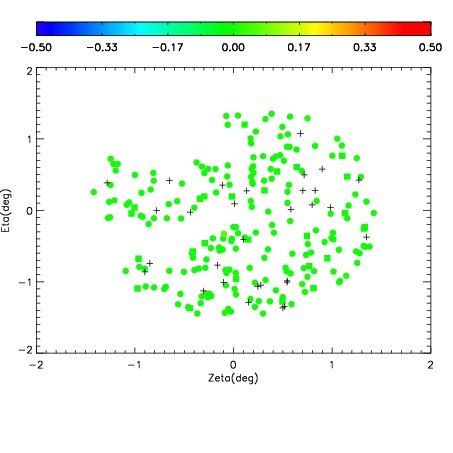
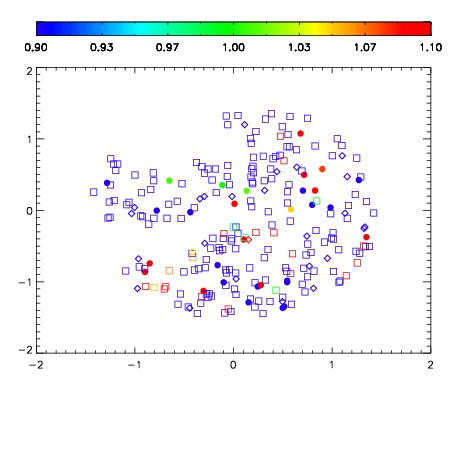
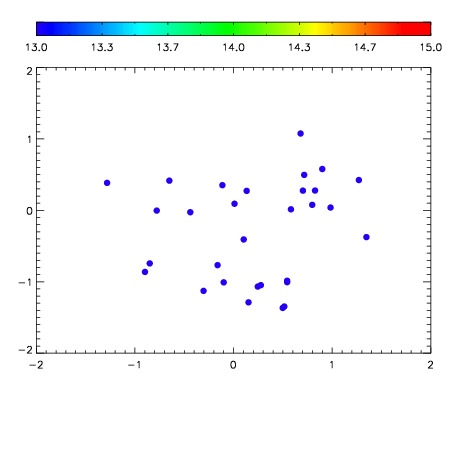

| Frame | Nreads | Zeropoints | Mag plots | Spatial mag deviation | Spatial sky 16325A emission deviations (filled: sky, open: star) | Spatial sky continuum emission | Spatial sky telluric CO2 absorption deviations (filled: H < 10) | |||||||||||||||||||||||
| 0 | 0 |
|
|
|
|
|
|
| IPAIR | NAME | SHIFT | NEWSHIFT | S/N | NAME | SHIFT | NEWSHIFT | S/N |
| 0 | 16320046 | 0.493759 | 0.00000 | 18.5182 | 16320045 | 0.00321930 | 0.490540 | 18.5172 |
| 1 | 16320038 | 0.491515 | 0.00224400 | 18.5401 | 16320044 | 0.00266517 | 0.491094 | 18.6284 |
| 2 | 16320043 | 0.491402 | 0.00235701 | 18.5299 | 16320037 | 0.00000 | 0.493759 | 18.5201 |
| 3 | 16320039 | 0.492439 | 0.00132000 | 18.4427 | 16320040 | 0.00300933 | 0.490750 | 18.4338 |
| 4 | 16320042 | 0.491913 | 0.00184602 | 18.0889 | 16320041 | 0.00165424 | 0.492105 | 18.1145 |
| 5 | 16320047 | 0.492875 | 0.000883996 | 17.9222 | 16320048 | 0.00280955 | 0.490949 | 17.8858 |