| Red | Green | Blue | |
| z | 17.64 | ||
| znorm | Inf | ||
| sky | -Inf | -Inf | -Inf |
| S/N | 16.5 | 29.5 | 33.0 |
| S/N(c) | 0.0 | 0.0 | 0.0 |
| SN(E/C) |
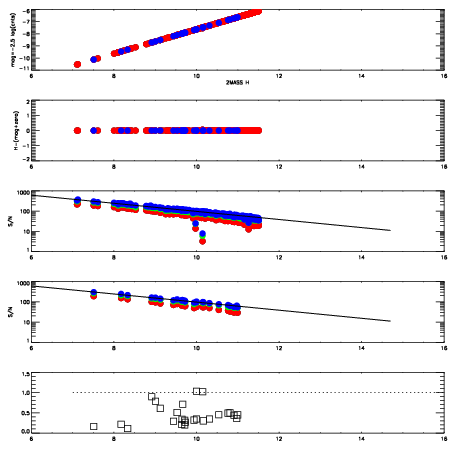


| Frame | Nreads | Zeropoints | Mag plots | Spatial mag deviation | Spatial sky 16325A emission deviations (filled: sky, open: star) | Spatial sky continuum emission | Spatial sky telluric CO2 absorption deviations (filled: H < 10) | |||||||||||||||||||||||
| 0 | 0 |
|
|
|
|
|
|
| IPAIR | NAME | SHIFT | NEWSHIFT | S/N | NAME | SHIFT | NEWSHIFT | S/N |
| 0 | 16330013 | 0.492314 | 0.00000 | 18.2638 | 16330014 | 0.00193761 | 0.490376 | 18.3313 |
| 1 | 16330012 | 0.490807 | 0.00150701 | 18.3859 | 16330011 | 0.00000 | 0.492314 | 18.3691 |
| 2 | 16330016 | 0.491895 | 0.000419021 | 18.2124 | 16330015 | 0.000202756 | 0.492111 | 18.2308 |