| Red | Green | Blue | |
| z | 17.64 | ||
| znorm | Inf | ||
| sky | -Inf | -Inf | -Inf |
| S/N | 14.1 | 24.8 | 29.7 |
| S/N(c) | 0.0 | 0.0 | 0.0 |
| SN(E/C) |
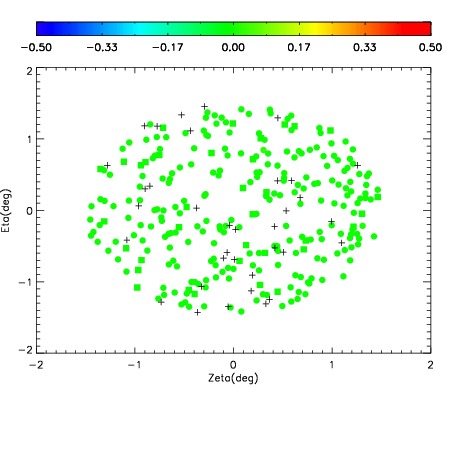
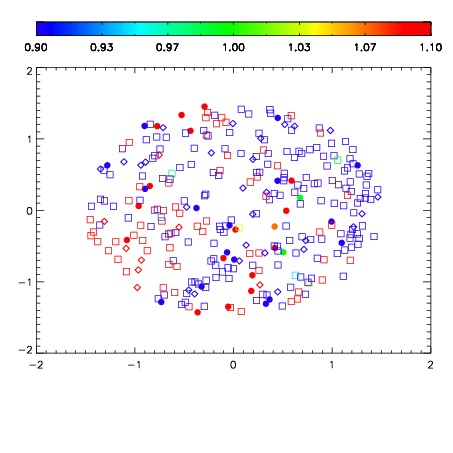
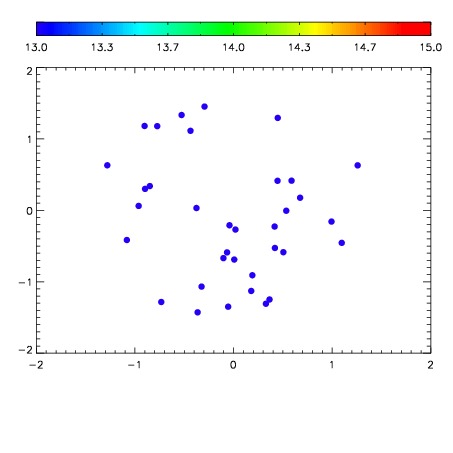

| Frame | Nreads | Zeropoints | Mag plots | Spatial mag deviation | Spatial sky 16325A emission deviations (filled: sky, open: star) | Spatial sky continuum emission | Spatial sky telluric CO2 absorption deviations (filled: H < 10) | |||||||||||||||||||||||
| 0 | 0 |
|
|
|
|
|
|
| IPAIR | NAME | SHIFT | NEWSHIFT | S/N | NAME | SHIFT | NEWSHIFT | S/N |
| 0 | 18720079 | 0.00281179 | 0.00000 | 18.0769 | 18720077 | -0.506475 | 0.509287 | 18.0001 |
| 1 | 18720078 | 0.000478853 | 0.00233294 | 18.1527 | 18720076 | -0.505916 | 0.508728 | 18.1888 |
| 2 | 18720075 | 0.00000 | 0.00281179 | 18.1449 | 18720081 | -0.506500 | 0.509312 | 18.1338 |
| 3 | 18720082 | 0.00178385 | 0.00102794 | 18.0912 | 18720080 | -0.506474 | 0.509286 | 18.0962 |