| Red | Green | Blue | |
| z | 17.64 | ||
| znorm | Inf | ||
| sky | -Inf | -Inf | -Inf |
| S/N | 24.0 | 39.1 | 47.8 |
| S/N(c) | 0.0 | 0.0 | 0.0 |
| SN(E/C) |
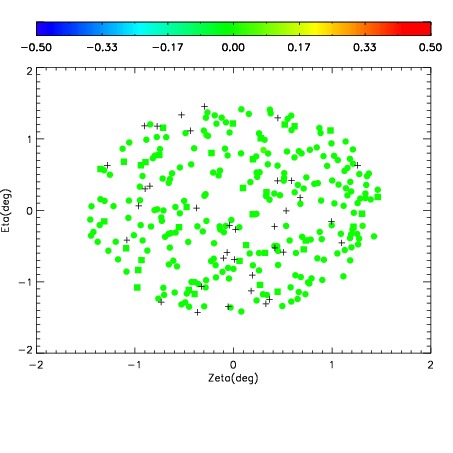
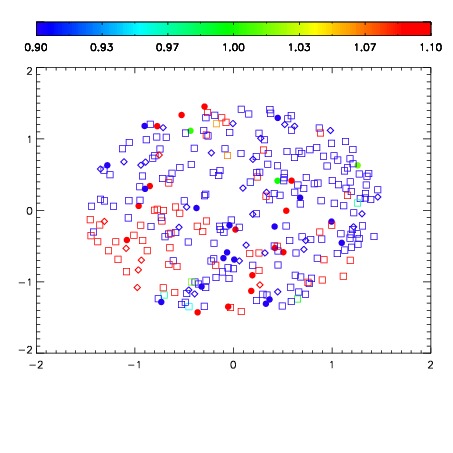
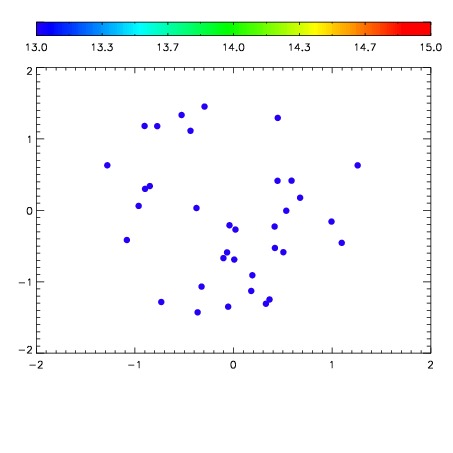

| Frame | Nreads | Zeropoints | Mag plots | Spatial mag deviation | Spatial sky 16325A emission deviations (filled: sky, open: star) | Spatial sky continuum emission | Spatial sky telluric CO2 absorption deviations (filled: H < 10) | |||||||||||||||||||||||
| 0 | 0 |
|
|
|
|
|
|
| IPAIR | NAME | SHIFT | NEWSHIFT | S/N | NAME | SHIFT | NEWSHIFT | S/N |
| 0 | 18730066 | 0.00182543 | 0.00000 | 18.2946 | 18730068 | -0.498534 | 0.500359 | 18.3172 |
| 1 | 18730065 | 0.00112989 | 0.000695540 | 18.5359 | 18730064 | -0.499657 | 0.501482 | 18.4798 |
| 2 | 18730062 | 0.00105195 | 0.000773480 | 18.4645 | 18730063 | -0.498920 | 0.500745 | 18.4611 |
| 3 | 18730069 | 0.00124414 | 0.000581290 | 18.4532 | 18730071 | -0.501011 | 0.502836 | 18.3733 |
| 4 | 18730070 | 0.00151501 | 0.000310420 | 18.3649 | 18730067 | -0.499128 | 0.500953 | 18.3198 |
| 5 | 18730061 | 0.000840487 | 0.000984943 | 18.0777 | 18730060 | -0.500035 | 0.501860 | 18.1115 |
| 6 | 18730058 | 0.00000 | 0.00182543 | 17.9586 | 18730059 | -0.501137 | 0.502962 | 17.9829 |