| Red | Green | Blue | |
| z | 17.64 | ||
| znorm | Inf | ||
| sky | -Inf | -Inf | -NaN |
| S/N | 15.4 | 27.0 | 31.8 |
| S/N(c) | 0.0 | 0.0 | 0.0 |
| SN(E/C) |
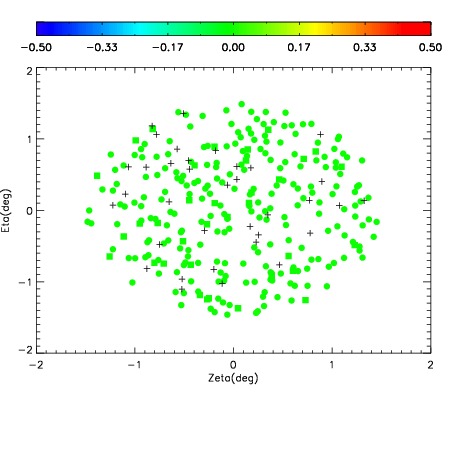
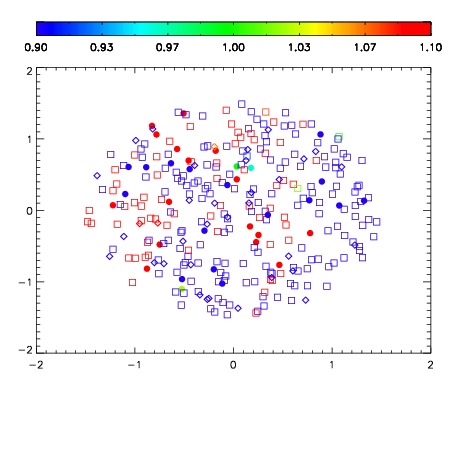
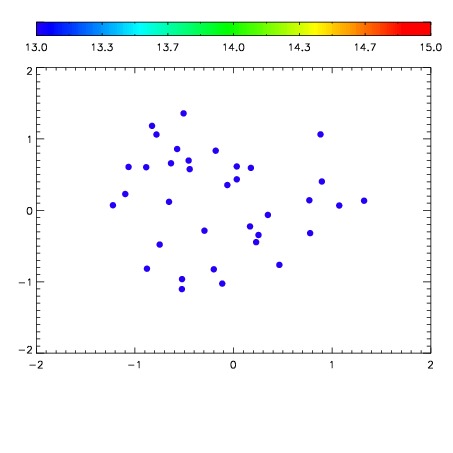

| Frame | Nreads | Zeropoints | Mag plots | Spatial mag deviation | Spatial sky 16325A emission deviations (filled: sky, open: star) | Spatial sky continuum emission | Spatial sky telluric CO2 absorption deviations (filled: H < 10) | |||||||||||||||||||||||
| 0 | 0 |
|
|
|
|
|
|
| IPAIR | NAME | SHIFT | NEWSHIFT | S/N | NAME | SHIFT | NEWSHIFT | S/N |
| 0 | 18740079 | 0.502561 | 0.00000 | 18.0864 | 18740077 | 0.00000 | 0.502561 | 18.1286 |
| 1 | 18740082 | 0.501827 | 0.000733972 | 18.3919 | 18740081 | 0.00218128 | 0.500380 | 18.4670 |
| 2 | 18740078 | 0.501148 | 0.00141299 | 18.0953 | 18740080 | 0.00188565 | 0.500675 | 18.1527 |