| Red | Green | Blue | |
| z | 17.64 | ||
| znorm | Inf | ||
| sky | -Inf | -Inf | -NaN |
| S/N | 26.6 | 47.0 | 54.2 |
| S/N(c) | 0.0 | 0.0 | 0.0 |
| SN(E/C) |
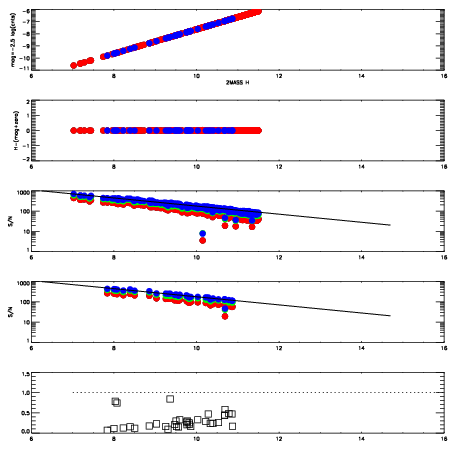
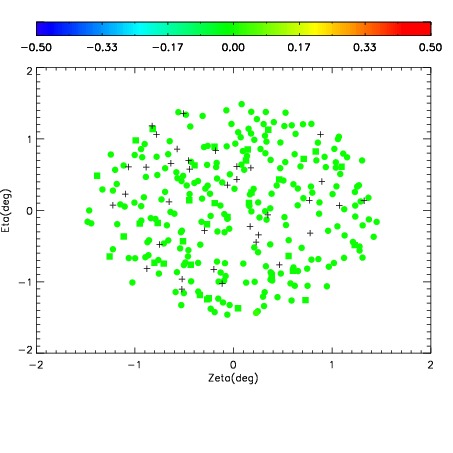
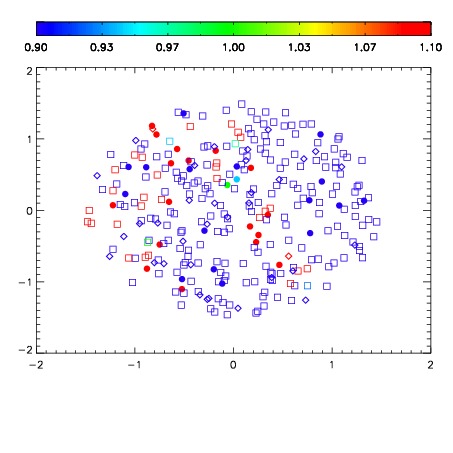
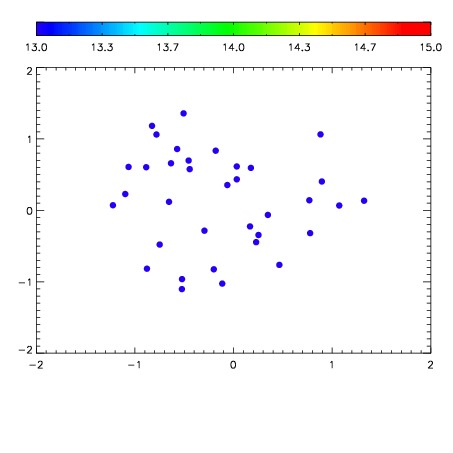

| Frame | Nreads | Zeropoints | Mag plots | Spatial mag deviation | Spatial sky 16325A emission deviations (filled: sky, open: star) | Spatial sky continuum emission | Spatial sky telluric CO2 absorption deviations (filled: H < 10) | |||||||||||||||||||||||
| 0 | 0 |
|
|
|
|
|
|
| IPAIR | NAME | SHIFT | NEWSHIFT | S/N | NAME | SHIFT | NEWSHIFT | S/N |
| 0 | 18900043 | 0.515502 | 0.00000 | 16.6077 | 18900045 | -5.31187e-05 | 0.515555 | 16.1351 |
| 1 | 18900059 | 0.507877 | 0.00762498 | 18.6952 | 18900060 | -0.00189549 | 0.517397 | 18.6578 |
| 2 | 18900054 | 0.512354 | 0.00314796 | 18.4365 | 18900048 | -0.000120158 | 0.515622 | 18.5970 |
| 3 | 18900062 | 0.510798 | 0.00470400 | 18.3814 | 18900053 | -0.00223208 | 0.517734 | 18.5946 |
| 4 | 18900058 | 0.507911 | 0.00759095 | 18.3200 | 18900052 | -0.00119451 | 0.516697 | 18.4858 |
| 5 | 18900055 | 0.512823 | 0.00267899 | 18.1578 | 18900061 | -0.00128889 | 0.516791 | 18.4448 |
| 6 | 18900047 | 0.513782 | 0.00171995 | 17.8689 | 18900057 | -0.00268170 | 0.518184 | 18.3814 |
| 7 | 18900063 | 0.511610 | 0.00389200 | 17.8086 | 18900056 | -0.00229658 | 0.517799 | 18.2943 |
| 8 | 18900050 | 0.514220 | 0.00128198 | 17.4371 | 18900064 | -0.000219506 | 0.515721 | 17.3892 |
| 9 | 18900051 | 0.514808 | 0.000693977 | 17.0865 | 18900049 | -1.92536e-06 | 0.515504 | 16.6829 |