| Red | Green | Blue | |
| z | 17.64 | ||
| znorm | Inf | ||
| sky | -Inf | -Inf | -NaN |
| S/N | 11.9 | 22.1 | 25.7 |
| S/N(c) | 0.0 | 0.0 | 0.0 |
| SN(E/C) |
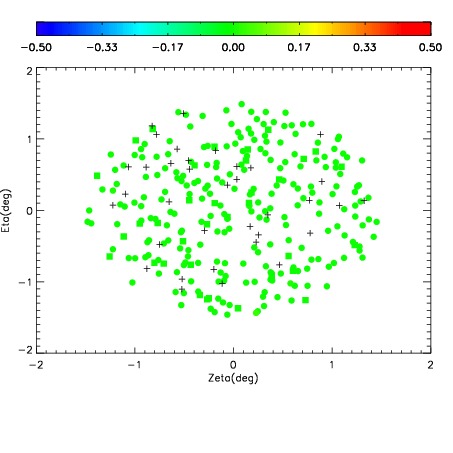
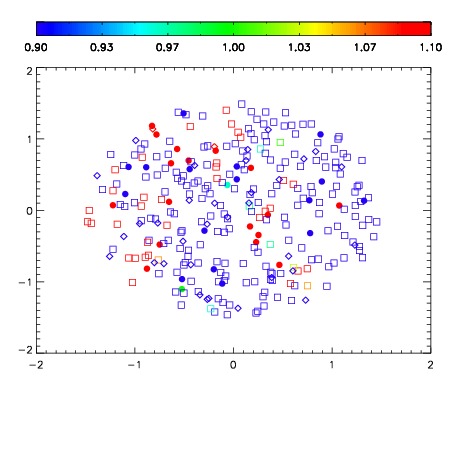


| Frame | Nreads | Zeropoints | Mag plots | Spatial mag deviation | Spatial sky 16325A emission deviations (filled: sky, open: star) | Spatial sky continuum emission | Spatial sky telluric CO2 absorption deviations (filled: H < 10) | |||||||||||||||||||||||
| 0 | 0 |
|
|
|
|
|
|
| IPAIR | NAME | SHIFT | NEWSHIFT | S/N | NAME | SHIFT | NEWSHIFT | S/N |
| 0 | 18910044 | 0.515078 | 0.00000 | 16.0870 | 18910045 | 0.00300378 | 0.512074 | 16.1302 |
| 1 | 18910040 | 0.513299 | 0.00177902 | 18.1183 | 18910041 | 0.000640191 | 0.514438 | 18.0821 |
| 2 | 18910039 | 0.513580 | 0.00149798 | 17.7649 | 18910042 | -4.76597e-05 | 0.515126 | 18.0616 |
| 3 | 18910043 | 0.514850 | 0.000227988 | 16.3956 | 18910038 | 0.00000 | 0.515078 | 17.7773 |