| Red | Green | Blue | |
| z | 17.64 | ||
| znorm | Inf | ||
| sky | -Inf | -Inf | -NaN |
| S/N | 14.7 | 27.0 | 29.0 |
| S/N(c) | 0.0 | 0.0 | 0.0 |
| SN(E/C) |
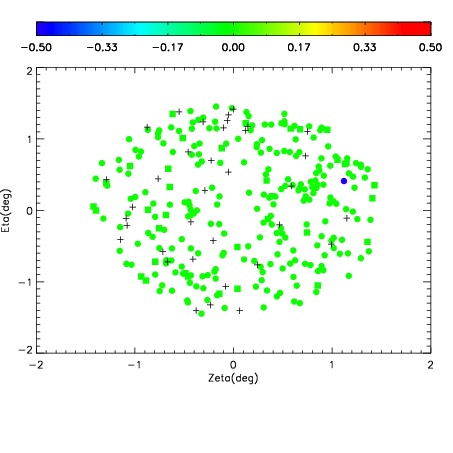
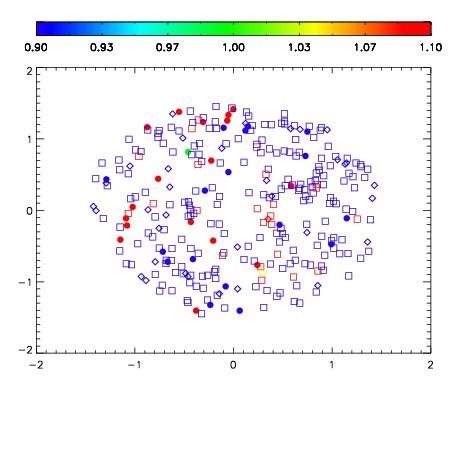
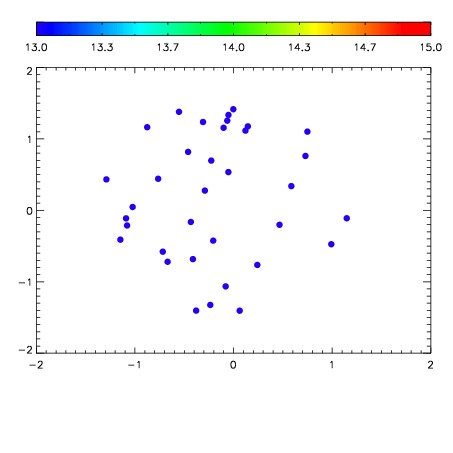

| Frame | Nreads | Zeropoints | Mag plots | Spatial mag deviation | Spatial sky 16325A emission deviations (filled: sky, open: star) | Spatial sky continuum emission | Spatial sky telluric CO2 absorption deviations (filled: H < 10) | |||||||||||||||||||||||
| 0 | 0 |
|
|
|
|
|
|
| IPAIR | NAME | SHIFT | NEWSHIFT | S/N | NAME | SHIFT | NEWSHIFT | S/N |
| 0 | 19030070 | 0.00385166 | 0.00000 | 18.4321 | 19030069 | -0.497623 | 0.501475 | 18.3983 |
| 1 | 19030067 | 0.00000 | 0.00385166 | 18.4700 | 19030068 | -0.496870 | 0.500722 | 18.4194 |
| 2 | 19030071 | 0.00384039 | 1.12702e-05 | 18.3390 | 19030072 | -0.497216 | 0.501068 | 18.3149 |