| Red | Green | Blue | |
| z | 17.64 | ||
| znorm | Inf | ||
| sky | -Inf | -Inf | -NaN |
| S/N | 14.5 | 27.0 | 28.6 |
| S/N(c) | 0.0 | 0.0 | 0.0 |
| SN(E/C) |
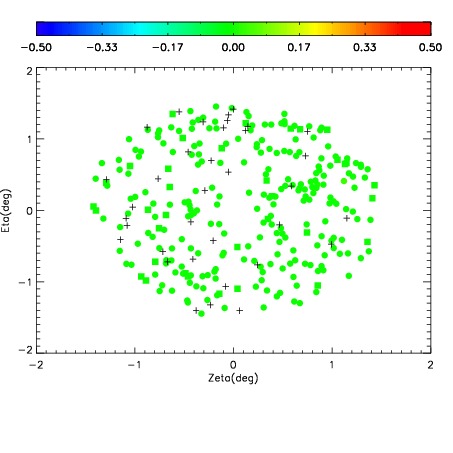
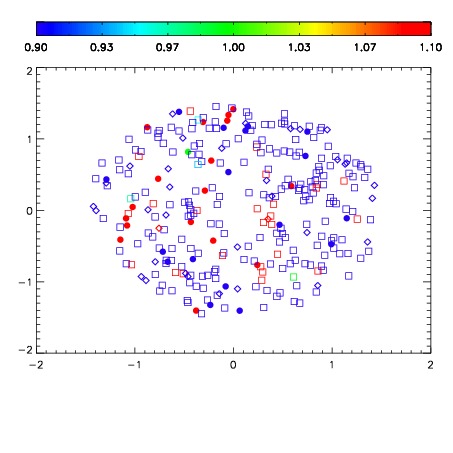
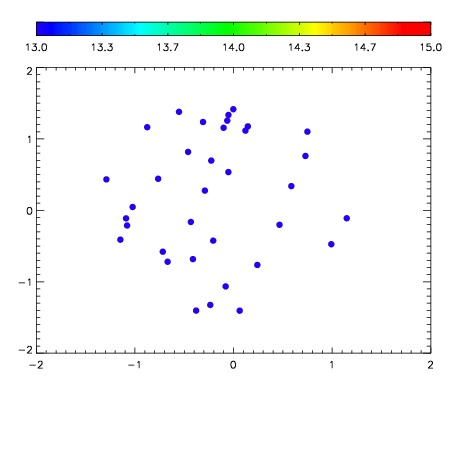

| Frame | Nreads | Zeropoints | Mag plots | Spatial mag deviation | Spatial sky 16325A emission deviations (filled: sky, open: star) | Spatial sky continuum emission | Spatial sky telluric CO2 absorption deviations (filled: H < 10) | |||||||||||||||||||||||
| 0 | 0 |
|
|
|
|
|
|
| IPAIR | NAME | SHIFT | NEWSHIFT | S/N | NAME | SHIFT | NEWSHIFT | S/N |
| 0 | 19040071 | 0.501197 | 0.00000 | 18.2929 | 19040072 | -0.00468979 | 0.505887 | 18.3244 |
| 1 | 19040070 | 0.499807 | 0.00138998 | 18.3926 | 19040069 | 0.00000 | 0.501197 | 18.3673 |
| 2 | 19040075 | 0.499261 | 0.00193599 | 18.2323 | 19040076 | -0.00491844 | 0.506115 | 18.3184 |
| 3 | 19040074 | 0.499429 | 0.00176799 | 18.0657 | 19040073 | -0.00479848 | 0.505995 | 18.0899 |