| Red | Green | Blue | |
| z | 17.64 | ||
| znorm | Inf | ||
| sky | -Inf | -Inf | -NaN |
| S/N | 13.3 | 24.4 | 26.6 |
| S/N(c) | 0.0 | 0.0 | 0.0 |
| SN(E/C) |
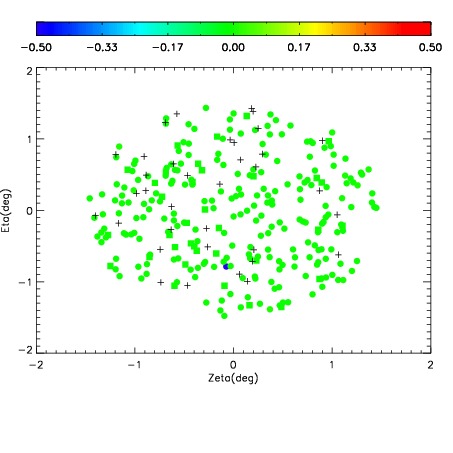
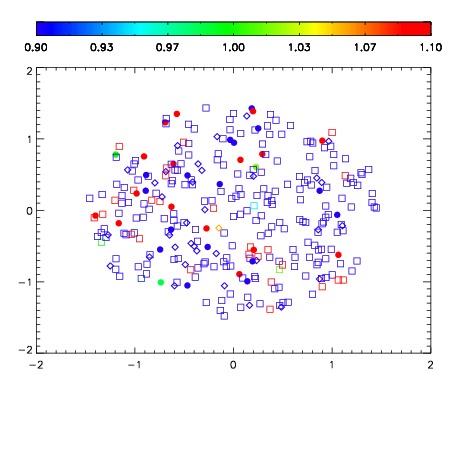
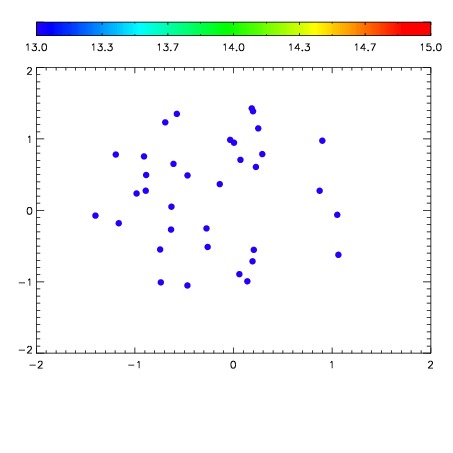

| Frame | Nreads | Zeropoints | Mag plots | Spatial mag deviation | Spatial sky 16325A emission deviations (filled: sky, open: star) | Spatial sky continuum emission | Spatial sky telluric CO2 absorption deviations (filled: H < 10) | |||||||||||||||||||||||
| 0 | 0 |
|
|
|
|
|
|
| IPAIR | NAME | SHIFT | NEWSHIFT | S/N | NAME | SHIFT | NEWSHIFT | S/N |
| 0 | 19330065 | 0.00138153 | 0.00000 | 18.4348 | 19330064 | -0.492078 | 0.493460 | 18.4844 |
| 1 | 19330062 | 0.00000 | 0.00138153 | 18.2617 | 19330063 | -0.491516 | 0.492898 | 18.3471 |
| 2 | 19330066 | 0.000832671 | 0.000548859 | 17.0789 | 19330067 | -0.492787 | 0.494169 | 17.0984 |