| Red | Green | Blue | |
| z | 17.64 | ||
| znorm | Inf | ||
| sky | -Inf | -Inf | -NaN |
| S/N | 14.0 | 26.1 | 28.2 |
| S/N(c) | 0.0 | 0.0 | 0.0 |
| SN(E/C) |
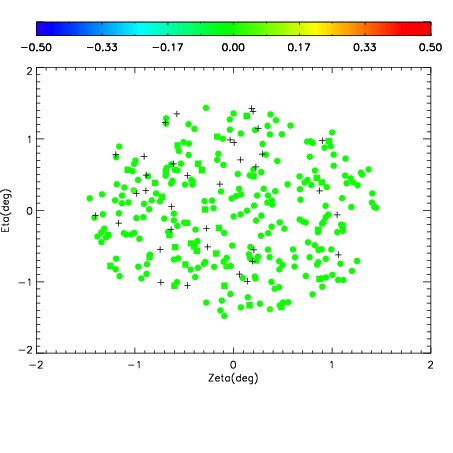
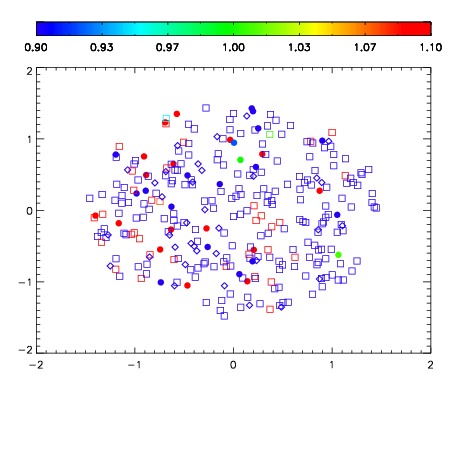
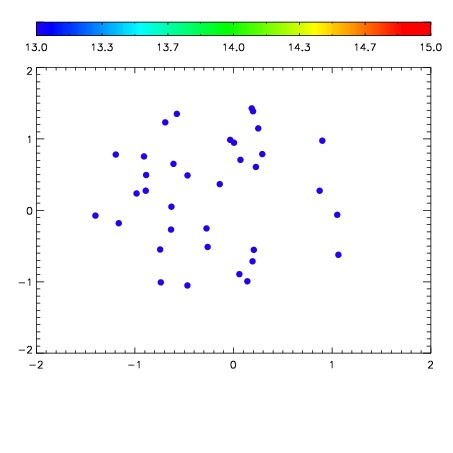

| Frame | Nreads | Zeropoints | Mag plots | Spatial mag deviation | Spatial sky 16325A emission deviations (filled: sky, open: star) | Spatial sky continuum emission | Spatial sky telluric CO2 absorption deviations (filled: H < 10) | |||||||||||||||||||||||
| 0 | 0 |
|
|
|
|
|
|
| IPAIR | NAME | SHIFT | NEWSHIFT | S/N | NAME | SHIFT | NEWSHIFT | S/N |
| 0 | 19440036 | 0.481568 | 0.00000 | 18.0065 | 19440037 | 0.000149719 | 0.481418 | 18.0944 |
| 1 | 19440039 | 0.481193 | 0.000375003 | 18.7806 | 19440038 | -0.000487600 | 0.482056 | 18.7459 |
| 2 | 19440035 | 0.481106 | 0.000461996 | 17.9610 | 19440034 | 0.00000 | 0.481568 | 17.9026 |