| Red | Green | Blue | |
| z | 17.64 | ||
| znorm | Inf | ||
| sky | -Inf | -NaN | -NaN |
| S/N | 12.2 | 24.4 | 25.3 |
| S/N(c) | 0.0 | 0.0 | 0.0 |
| SN(E/C) |

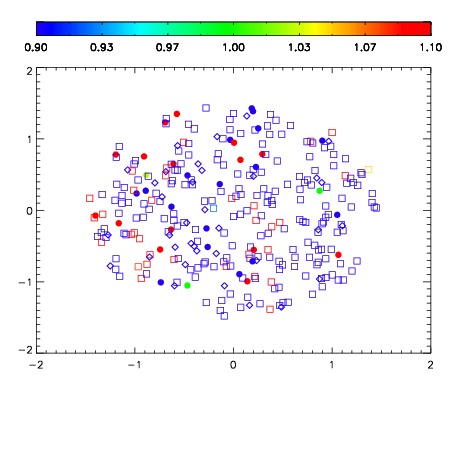


| Frame | Nreads | Zeropoints | Mag plots | Spatial mag deviation | Spatial sky 16325A emission deviations (filled: sky, open: star) | Spatial sky continuum emission | Spatial sky telluric CO2 absorption deviations (filled: H < 10) | |||||||||||||||||||||||
| 0 | 0 |
|
|
|
|
|
|
| IPAIR | NAME | SHIFT | NEWSHIFT | S/N | NAME | SHIFT | NEWSHIFT | S/N |
| 0 | 19450012 | 0.486349 | 0.00000 | 17.9497 | 19450011 | 0.00000 | 0.486349 | 17.9476 |
| 1 | 19450016 | 0.485205 | 0.00114399 | 18.5017 | 19450015 | -0.000330752 | 0.486680 | 18.4944 |
| 2 | 19450013 | 0.485789 | 0.000559986 | 17.9848 | 19450014 | 0.000476358 | 0.485873 | 18.0001 |