| Red | Green | Blue | |
| z | 17.64 | ||
| znorm | Inf | ||
| sky | -Inf | -Inf | -Inf |
| S/N | 12.9 | 23.1 | 25.2 |
| S/N(c) | 0.0 | 0.0 | 0.0 |
| SN(E/C) |
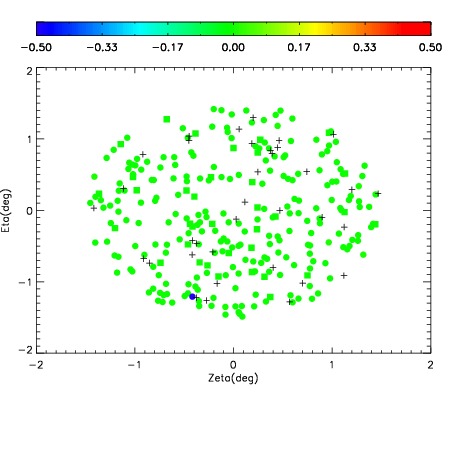
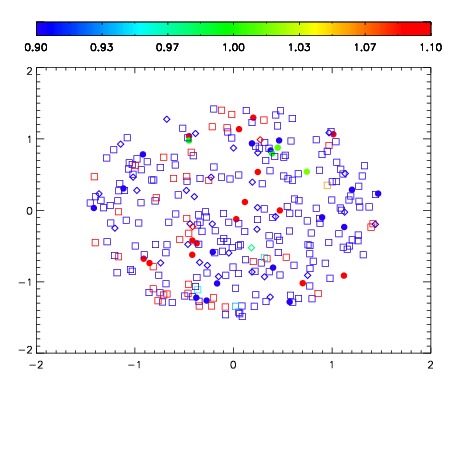
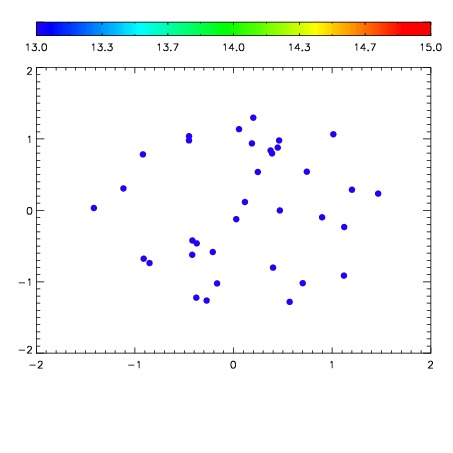

| Frame | Nreads | Zeropoints | Mag plots | Spatial mag deviation | Spatial sky 16325A emission deviations (filled: sky, open: star) | Spatial sky continuum emission | Spatial sky telluric CO2 absorption deviations (filled: H < 10) | |||||||||||||||||||||||
| 0 | 0 |
|
|
|
|
|
|
| IPAIR | NAME | SHIFT | NEWSHIFT | S/N | NAME | SHIFT | NEWSHIFT | S/N |
| 0 | 18960070 | 0.00594885 | 0.00000 | 18.1493 | 18960071 | -0.499489 | 0.505438 | 18.2343 |
| 1 | 18960066 | 0.00000 | 0.00594885 | 18.5613 | 18960067 | -0.501756 | 0.507705 | 18.6399 |
| 2 | 18960069 | 0.00508770 | 0.000861150 | 18.3482 | 18960068 | -0.500696 | 0.506645 | 18.2504 |