| Red | Green | Blue | |
| z | 17.64 | ||
| znorm | Inf | ||
| sky | -Inf | -Inf | -Inf |
| S/N | 19.4 | 33.8 | 35.9 |
| S/N(c) | 0.0 | 0.0 | 0.0 |
| SN(E/C) |
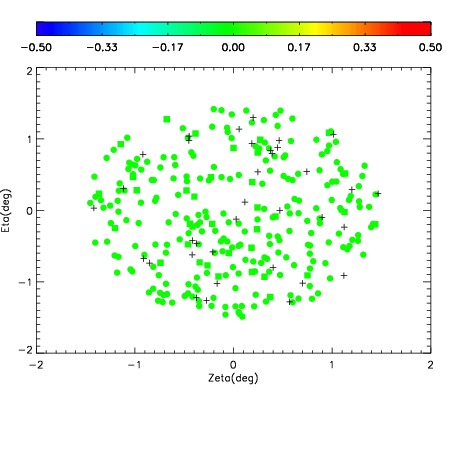
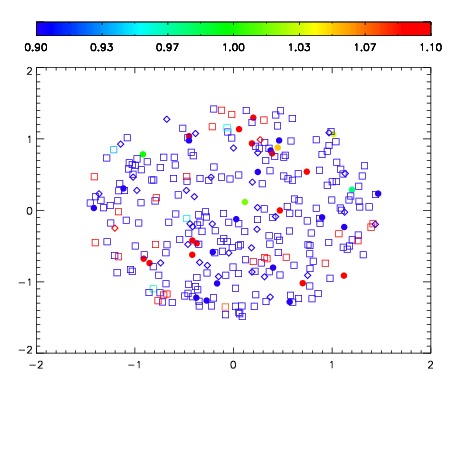
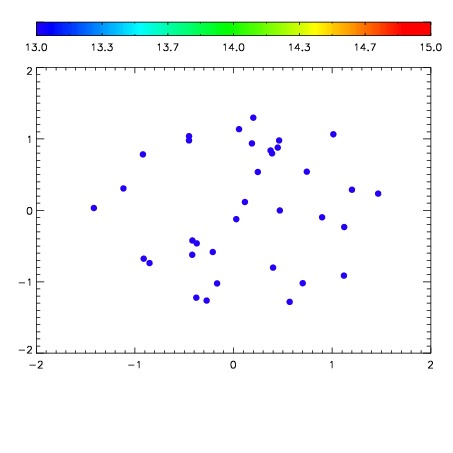

| Frame | Nreads | Zeropoints | Mag plots | Spatial mag deviation | Spatial sky 16325A emission deviations (filled: sky, open: star) | Spatial sky continuum emission | Spatial sky telluric CO2 absorption deviations (filled: H < 10) | |||||||||||||||||||||||
| 0 | 0 |
|
|
|
|
|
|
| IPAIR | NAME | SHIFT | NEWSHIFT | S/N | NAME | SHIFT | NEWSHIFT | S/N |
| 0 | 18980028 | 0.00527697 | 0.00000 | 18.0712 | 18980029 | -0.502578 | 0.507855 | 18.0905 |
| 1 | 18980024 | 0.00294800 | 0.00232897 | 18.6441 | 18980025 | -0.500182 | 0.505459 | 18.6257 |
| 2 | 18980031 | 0.00369978 | 0.00157719 | 18.4131 | 18980030 | -0.502608 | 0.507885 | 18.3993 |
| 3 | 18980027 | 0.00367649 | 0.00160048 | 18.2128 | 18980026 | -0.500428 | 0.505705 | 18.1957 |
| 4 | 18980023 | 0.00432452 | 0.000952450 | 17.9708 | 18980022 | -0.503586 | 0.508863 | 17.9369 |
| 5 | 18980020 | 0.00000 | 0.00527697 | 17.8765 | 18980021 | -0.503266 | 0.508543 | 17.9300 |