| Red | Green | Blue | |
| z | 17.64 | ||
| znorm | Inf | ||
| sky | -Inf | -NaN | -Inf |
| S/N | 31.1 | 54.4 | 55.3 |
| S/N(c) | 0.0 | 0.0 | 0.0 |
| SN(E/C) |
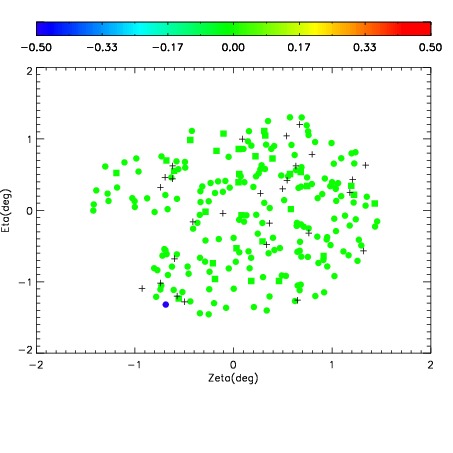
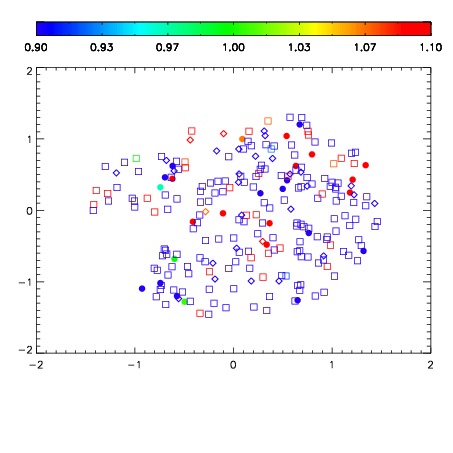
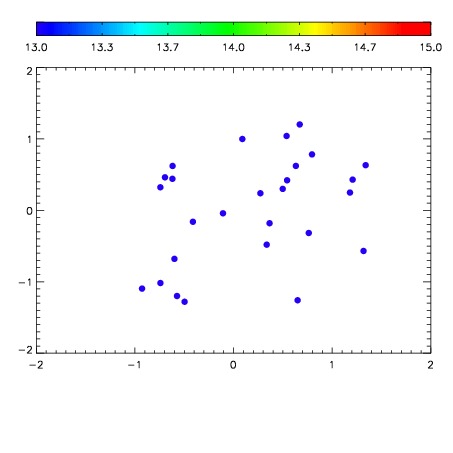

| Frame | Nreads | Zeropoints | Mag plots | Spatial mag deviation | Spatial sky 16325A emission deviations (filled: sky, open: star) | Spatial sky continuum emission | Spatial sky telluric CO2 absorption deviations (filled: H < 10) | |||||||||||||||||||||||
| 0 | 0 |
|
|
|
|
|
|
| IPAIR | NAME | SHIFT | NEWSHIFT | S/N | NAME | SHIFT | NEWSHIFT | S/N |
| 0 | 16300029 | 0.498863 | 0.00000 | 18.0722 | 16300018 | 0.00499337 | 0.493870 | 18.0142 |
| 1 | 16300013 | 0.493509 | 0.00535402 | 18.8201 | 16300014 | 0.00212342 | 0.496740 | 18.8354 |
| 2 | 16300012 | 0.493149 | 0.00571400 | 18.7098 | 16300011 | 0.00000 | 0.498863 | 18.8174 |
| 3 | 16300020 | 0.494970 | 0.00389302 | 18.6544 | 16300019 | 0.00362036 | 0.495243 | 18.6823 |
| 4 | 16300025 | 0.496790 | 0.00207302 | 18.5454 | 16300026 | 0.00612790 | 0.492735 | 18.4473 |
| 5 | 16300033 | 0.497513 | 0.00135002 | 18.2809 | 16300034 | 0.00674429 | 0.492119 | 18.3044 |
| 6 | 16300021 | 0.496766 | 0.00209701 | 18.1980 | 16300027 | 0.00623219 | 0.492631 | 18.2964 |
| 7 | 16300028 | 0.497693 | 0.00117001 | 18.1839 | 16300022 | 0.00499194 | 0.493871 | 18.2378 |
| 8 | 16300024 | 0.497802 | 0.00106102 | 18.1192 | 16300030 | 0.00679073 | 0.492072 | 18.0693 |
| 9 | 16300016 | 0.494657 | 0.00420600 | 18.1030 | 16300015 | 0.00325227 | 0.495611 | 18.0198 |
| 10 | 16300017 | 0.494953 | 0.00391001 | 18.0065 | 16300023 | 0.00578144 | 0.493082 | 17.9910 |