| Red | Green | Blue | |
| z | 17.64 | ||
| znorm | Inf | ||
| sky | -Inf | -Inf | -NaN |
| S/N | 20.9 | 39.1 | 41.9 |
| S/N(c) | 0.0 | 0.0 | 0.0 |
| SN(E/C) |
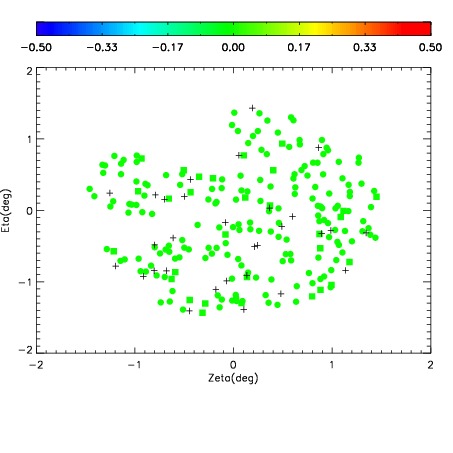
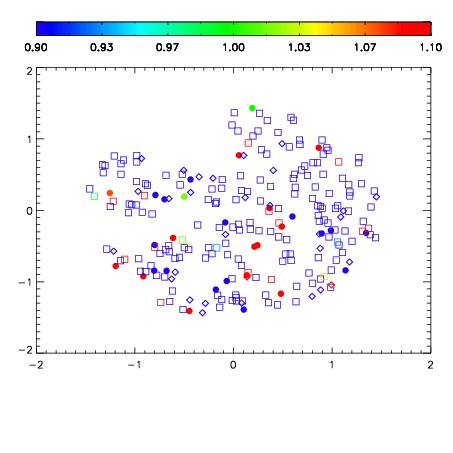
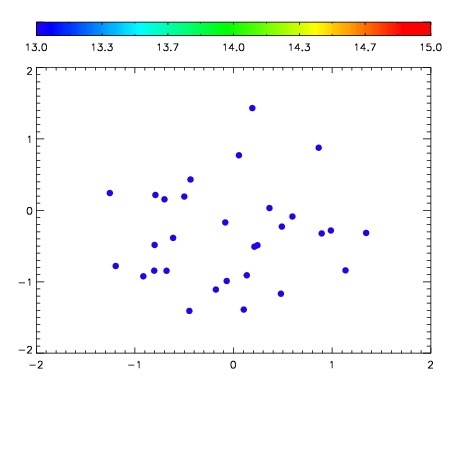

| Frame | Nreads | Zeropoints | Mag plots | Spatial mag deviation | Spatial sky 16325A emission deviations (filled: sky, open: star) | Spatial sky continuum emission | Spatial sky telluric CO2 absorption deviations (filled: H < 10) | |||||||||||||||||||||||
| 0 | 0 |
|
|
|
|
|
|
| IPAIR | NAME | SHIFT | NEWSHIFT | S/N | NAME | SHIFT | NEWSHIFT | S/N |
| 0 | 16280037 | 0.000111430 | 0.00000 | 17.9998 | 16280026 | -0.488935 | 0.489046 | 16.0436 |
| 1 | 16280033 | -7.91023e-05 | 0.000190532 | 18.3105 | 16280038 | -0.489499 | 0.489610 | 18.2112 |
| 2 | 16280029 | -0.000883395 | 0.000994825 | 18.2420 | 16280039 | -0.488980 | 0.489091 | 18.1449 |
| 3 | 16280032 | -0.000567433 | 0.000678863 | 18.1759 | 16280034 | -0.487746 | 0.487857 | 18.1126 |
| 4 | 16280040 | -0.00202610 | 0.00213753 | 18.1203 | 16280031 | -0.488407 | 0.488518 | 17.9864 |
| 5 | 16280025 | 0.00000 | 0.000111430 | 18.0885 | 16280030 | -0.489076 | 0.489187 | 17.9404 |
| 6 | 16280036 | -2.23901e-05 | 0.000133820 | 18.0576 | 16280035 | -0.489246 | 0.489357 | 17.8034 |